Conversion Rate Optimization (CRO) plays a vital role in turning website visitors into loyal customers. Businesses focus on CRO in 2025 to boost sales without spending more on ads.
The average conversion rate across all industries hits 2.9%, while e-commerce sites average 2.7%. Paid searches deliver 3.2%, and top-performing websites reach 5.31% or higher. Companies invest up to 30% of marketing budgets in CRO, spending $2,000 monthly on tools that yield 223% ROI on average.
CRO involves tweaking websites to encourage actions like purchases or sign-ups. With mobile driving 73% of e-commerce growth and AI influencing 54% of decisions, staying current on Conversion Rate Optimization statistics 2025 helps you refine tactics.
These numbers reveal industry benchmarks, emerging trends like personalization, and ways to overcome challenges.
If you own an online store, manage marketing, or run a site, these Conversion Rate Optimization statistics 2025 offer practical guidance. Discover averages by sector, how videos lift rates by 80%, and tips from Quora and Reddit users.
This guide explains the data and shows how you apply it to increase revenue, reduce costs, and improve user experiences.
Key Conversion Rate Optimization Statistics 2026 (Top Picks)
These highlights summarize CRO’s power in 2025. They help you benchmark your performance and identify quick improvements.
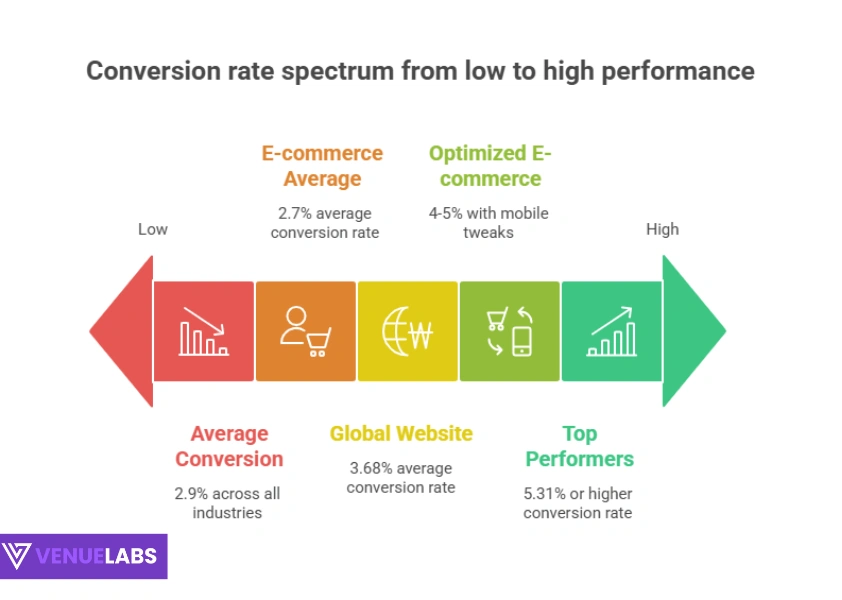
- Industries average 2.9% conversion rates, with top 25% sites at 5.31% and elite 10% at 11.45% or more.
- E-commerce hits 2.7% on average, but optimized pages reach 4-5% through mobile tweaks and videos.
- Global website rates average 3.68%, desktops 4.14%, mobiles 1.53%—highlighting mobile optimization needs.
- CRO tools deliver 223% ROI, with businesses spending $2,000 monthly and allocating 30% of budgets.
- AI Copywriting Tools boosts conversions 9% via chatbots, influencing 54% of shopping choices.
- Personalization lifts rates 202%, as 80% of consumers prefer tailored experiences.
- Videos on landing pages increase conversions 86%, A/B testing 49%.
- Bounce rates sit at 26-70%, with 1-second delays cutting conversions 7%.
- Only 22% of businesses satisfy with rates, showing widespread improvement potential.
- Food & beverage leads industries at 8.98%, while B2B averages 2.1-4.6%.
Use these to your advantage: If your rate lags 2.9%, add personalization for 202% gains or videos for 86% boosts. Businesses see 223% ROI—start testing high-traffic pages.
General Conversion Rate Optimization Statistics 2025
Businesses embrace CRO to maximize traffic in 2025. 69% adopt tools for optimization, but 40% lack dedicated roles, with teams managing 30% and individuals 29%. Leads challenge: 79% fail to convert, 56% aren’t ready. Positive in-store buys drive 63% online conversions.
Marketers face converting leads (55%) and tracking rates (82%). Post-COVID hurdles include leader buy-in and processes. You benefit by assigning CRO owners—firms with them see 14% higher rates. Use UX testing (64%) to fix 79% non-converting leads.
Additional stats:
- 68% small businesses ignore CRO, missing 6-12% inbound lifts.
- Inbound marketing raises rates 6% average.
- 39.6% document strategies for consistency.
- Under 0.11% test sites—do so for advantage.
Table of adoption techniques:
| Technique | Rate |
| UX Testing | 64% |
| Personalization | 61% |
| Content Testing | 57% |
Source: VWO.
Begin with UX tests to address 79% lead issues.
Average Conversion Rate Statistics 2025
- Averages set baselines. Sites hit 2-5%, top 25% 5.31%, 10% 11.45%+. Desktops 4.14%, tablets 3.36%, mobiles 1.53%.
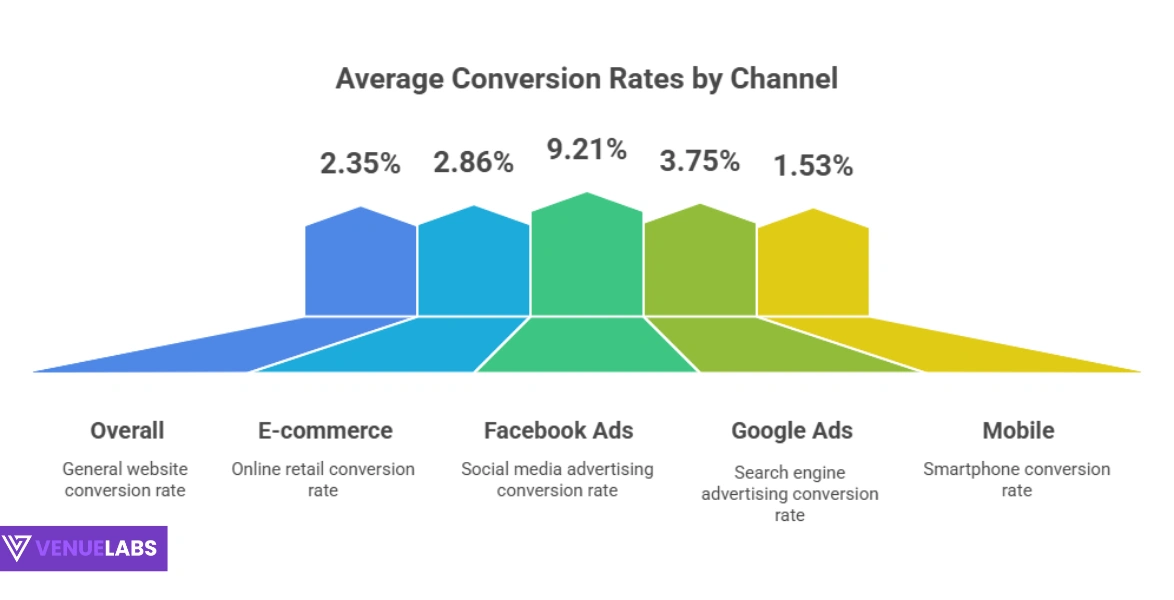
- Paid search 3.2%, Facebook ads 9.21%, Google ads 3.75%, Instagram 1.5%. B2B marketers prioritize rates for pages (75%).
- Improve with CTAs (28% lift) or videos (86%). Test devices; mobiles require focus as rates trail.
Table of channel averages:
| Channel | Rate |
| Overall | 2.35% |
| E-commerce | 2.86% |
| Facebook Ads | 9.21% |
| Google Ads | 3.75% |
| Mobile | 1.53% |
Source: WordStream.
Aim above—personalize for 202% better.
Conversion Rate Optimization Statistics 2026 by Industry
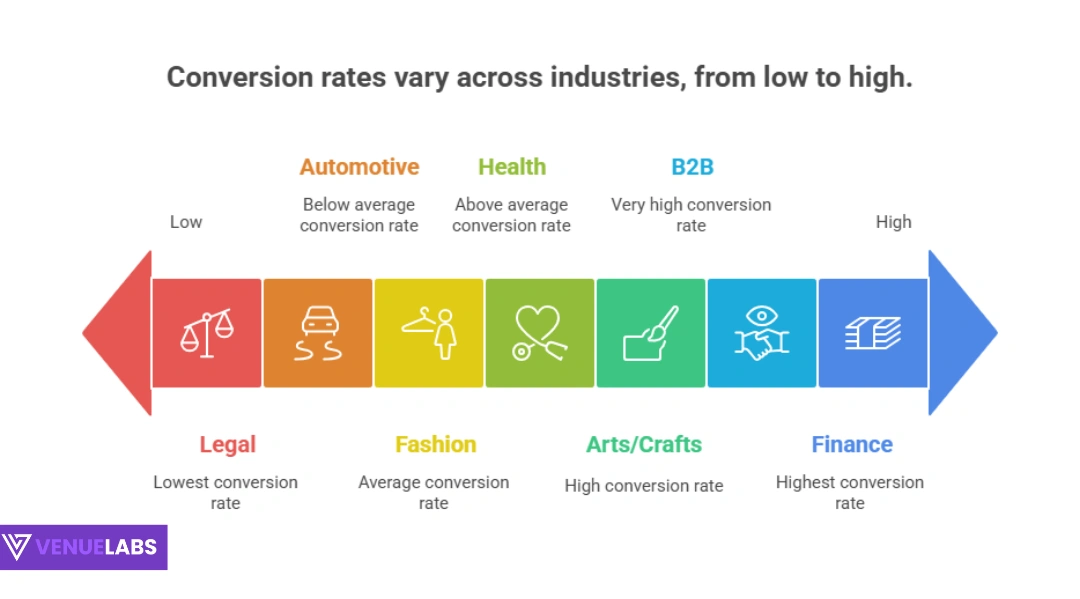
Rates differ. Food/beverage tops at 8.98%, physicians/surgeons >4.8%. B2B legal 7.4%, POS 2-5%, real estate 2.7%, rehab 2.1%.
E-com global 3.76%, arts/crafts 3.84-4.07%, health 2.8%, fashion 3.2%. Paid search finance 15.6%, B2B services 0.9%.
Customize: Finance adds trust (32% lift), fashion images (9%). Benefit: Benchmark—arts use videos for 86%.
Table of industry rates:
| Industry | Rate |
| Food/Beverage | 8.98% |
| Finance | 5.01-15% |
| B2B | 2.23-4.31% |
| Arts/Crafts | 3.79% |
| Health | 3.62% |
| Fashion | 3.2% |
If below, test CTAs.
Mobile Conversion Rate Optimization Statistics 2025
Mobile fuels 73% e-com growth, rates 2.58%, vs. desktop 4.14%. >3s load loses 53%, 15s average cuts 20%.
70% searches act in hour. Abandon 85.65%. Poor design deters 57%, no return 61%.
Optimize: Responsive 5.7% higher, notifications 7.8%. Gain: Speed for 7% save per second, chat 45%.
More:
- 48% frustrated non-mobile.
- Retail mobile 2.32%, top 5.31%.
Fix for 70% fast actions.
Landing Page Conversion Rate Optimization Statistics 2026
- Pages average 9.7%, e-com 12.9%, entertainment 18.1%. Benchmark 2-5%, top 9.7%.
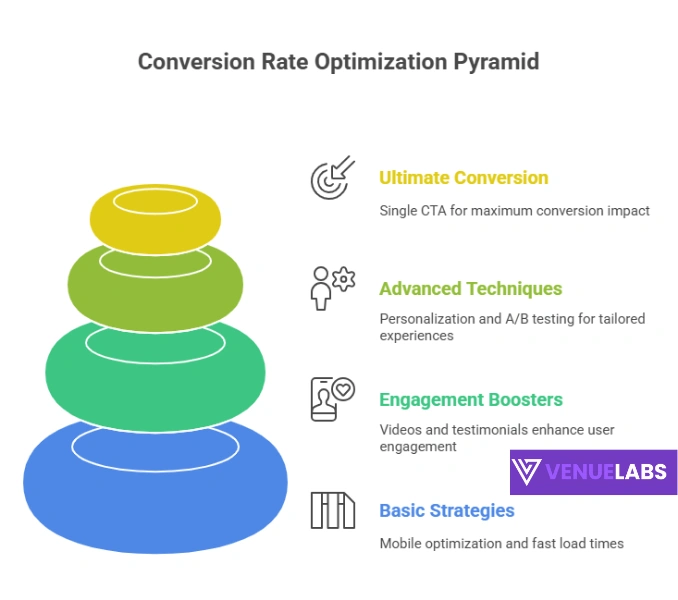
- Single CTA 371%, videos 86%, testimonials 34%, props 34%. Mobile 27%, <3s 32%. A/B 30%, proof 12.5%, personalize 202%.
- 57% B2B track rates. Benefit: No nav doubles sign-ups. Test high pages.
Table of lifts:
| Element | Lift |
| Video | 86% |
| Testimonials | 34% |
| Single CTA | 371% |
| Personalize | 202% |
Source: Statista.
Bounce Rate Statistics 2025
- Rates 26-70%, mobile 51%. Apparel 45%, food 55-65%, health 60%, electronics 54%, finance 50%, SaaS 65%.
- Delays: 1-3s +32%, 1-6s +90%, 1-10s +123%. Reduce: <3s for 32% keep. Engage content cuts.
Table sectors:
| Sector | Rate |
| Apparel | 45% |
| Electronics | 54% |
| Health | 60% |
| SaaS | 65% |
CRO Adoption and Spending Statistics 2026
- 69% use tools, 68% small skip. 53% <5% budget, top 5%. Monthly $10-500, large $2,000. Market 10% CAGR to $5.07B.
- ROI 223%, some >1000%. Agencies $800-10,000.
- Start small—free tools. Document (39.6%) for consistency.
Email Conversion Rate Statistics 2026
- Average 17.75%, CTR 15.22%. Personalized subjects +22% opens, no subject +8%.
- Cart 8.24%. Benefit: Segment +760% revenue. Personalize for 18.8% vs. 13.1%.
Conversion Funnel, A/B, Personalization, UX, Video Stats 2026
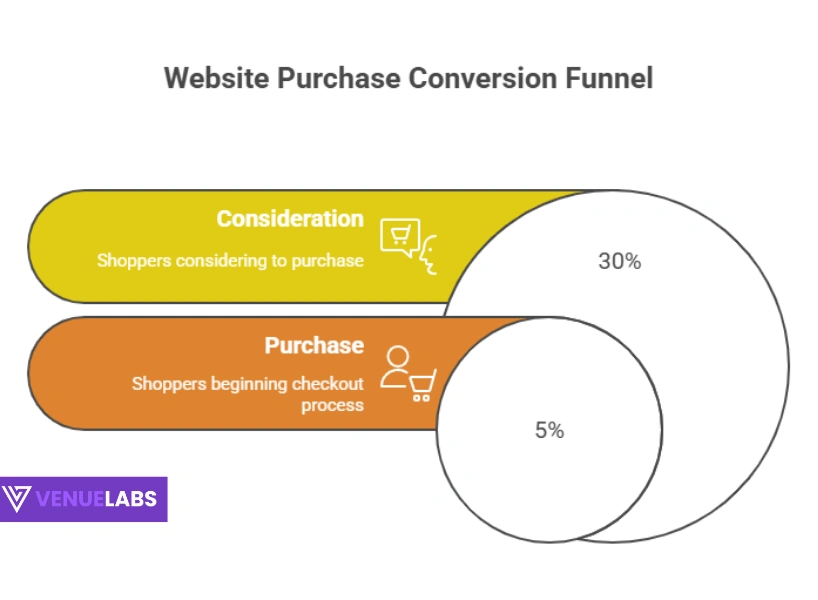
- Funnel: Awareness 2-4%, consider 20-30%, purchase 2-5%. Cart 75.6%, form 81%.
- A/B: 49% lift, 14% companies, 27% mobile. 71% <5 tests/month.
- Personal: CTAs +202%, 80% likely buy, 91% relevant. Emails +26% opens.
- UX: Great 14.4% vs. poor 6%, UI +200%. Checkout 23% vs. 16%.
- Video: 80% landing, 200-300% email CTR, 144% product.
- A/B CTAs (+49% CTR), personalize +300%.
Challenges in CRO 2026
22% satisfied rates, 28% budget, 63% data. 31% structured testing, 88% bad experience returns.
Overcome with AI (79% low trust), but tools help. Avoid insignificant tests.
Latest Insights from Quora and Reddit on Conversion Rate Optimization Statistics 2026
Users on Quora and Reddit discuss 2025 CRO trends, emphasizing AI and tools. On Quora, queries on “CRO in 2025” focus on AI for personalization and A/B, with rates up 121% from CTAs. Users ask about tools: Google Analytics for tracking, noting 2025 CRO on UX and data.
Reddit in r/AppStoreOptimization questions good rates: Apps aim 2-10%, with paywalls key. r/PPC notes Q2 2025 drops in impressions but CTR up, blaming algorithms. r/conversionrate debates endless optimization—99% possible but rare, focus continuously. r/SaaS shares low rates sh*t, but Fiverr CRO lifts 30%. r/SEO traffic up post-update but rates down 2.5% to 1.8%. r/Entrepreneur: Success at 2-4%, low <1% failure. r/digital_marketing: 2025 skill CRO with analytics. r/marketing: Landing 10%, lead-sale 30%. r/PPC scaling 20% budget steps.
These provide fresh views: AI predictive, balance short/long-term, use Reddit feedback for 30% lifts.
How to Use Conversion Rate Optimization Statistics 2026 for Your Benefit
- These stats guide actions. Benchmark vs. 2.9%—below? Fix loads (7% loss/second), add videos (86%). Invest 5% budget for 223% ROI; free A/B for 49%.
- Mobile: <3s to keep 53%, chat +45%. Personalize CTAs +202%—use 69% tools. E-com: Images +9%, trust +32%.
- Challenges: Document (39.6%) to beat 63% data issues. From forums: AI modeling, consistent tests. Track UX +200% UI.
FAQs About Conversion Rate Optimization Statistics
1. What is the average CRO rate in 2025?
The average conversion rate optimization (CRO) rate across industries is 2.9%. For e-commerce, it’s 2.7%, while top-performing sites see rates of 5.31% or higher.
2. How does AI impact CRO?
AI influences 54% of consumer decisions and boosts conversions by 9% through tools like chatbots. It also drives a 202% lift in personalization efforts, making it a powerful asset for CRO.
3. What's a good mobile conversion rate?
Mobile conversion rates typically range from 1.53% to 2.58%. To maximize conversions, ensure page load times are under 3 seconds, as delays can cause a 20% drop in conversions.
4. How much should I spend on CRO?
Allocate up to 30% of your marketing budget to CRO. Expect to spend around $2,000 per month on tools, with the potential to achieve a 223% ROI.
5. Why do leads not convert?
Around 79% of leads don’t convert, with 56% simply not being ready to buy. Leveraging inbound marketing strategies (which can lead to a 6% lift in conversions) and personalization can help overcome this challenge.
Also Read:
- Latest Digital Marketing Statistics
- Video Marketing Statistics
- Google Searches Statistics
- Affiliate Marketing Statistics
- CRM Statistics
Conclusion
Conversion Rate Optimization statistics 2025 show CRO drives business success with an average rate of 2.9% and a 223% ROI.
Mobile powers 73% of e-commerce growth, AI shapes 54% of decisions, and personalization boosts rates by 202%. Insights from Quora and Reddit highlight the need for AI tools and continuous testing to stay ahead.
Act now: Benchmark your site against 2.9%, optimize mobile for fast loads, and add personalized CTAs for big wins. Use A/B tests to lift conversions by 49% and videos for 86% gains.
Start with free tools, document strategies, and track user behavior to refine your approach. Embrace CRO in 2025 to turn clicks into customers, boost revenue, and keep users happy.


Comments
Be the first to leave a comment.