The internet continues its rapid expansion, connecting billions of people across the globe and transforming daily life.
In Internet User Statistics 2025, we see more people online than ever before, using digital platforms for everything from shopping and entertainment to education and communication.
Understanding these internet usage statistics helps individuals and businesses leverage the digital landscape for greater benefit.
Global Connectivity: A World Online
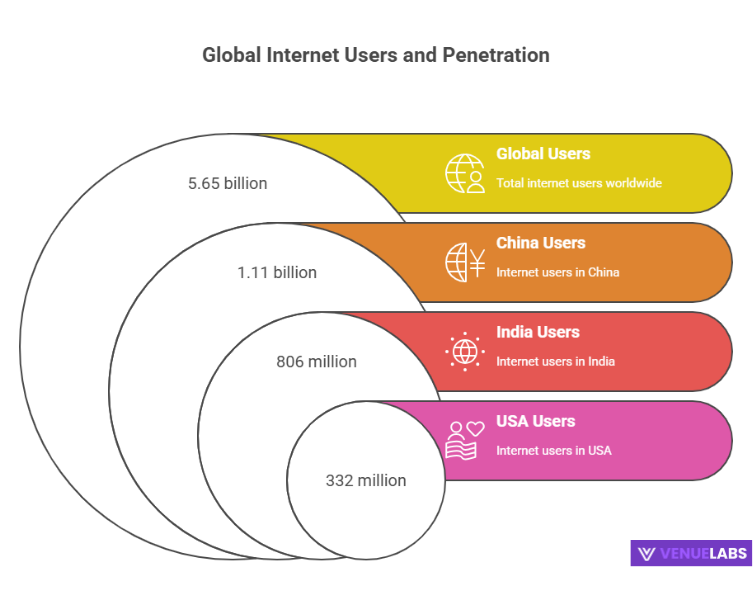
A staggering 5.65 billion people worldwide now actively use the internet. This number represents 68.7% of the entire global population.
This incredible growth reflects the increasing accessibility of smartphones, more affordable data plans, and the ever-growing popularity of online services. Just seven years ago, in July 2018, only 3.85 billion people were online, showing a jump of 1.8 billion new users.
Here’s how internet users have grown over the past few years:
| Year | Number of Internet Users (Billions) |
| July 2025 | 5.65 |
| July 2024 | 5.45 |
| July 2023 | 5.28 |
| July 2022 | 5.14 |
| July 2021 | 4.91 |
| July 2020 | 4.63 |
| July 2019 | 4.18 |
| July 2018 | 3.85 |
The percentage of the world online also shows a strong upward trend. In 2017, only half the world had internet access. Today, that figure stands at nearly 70%.
| Year | Percentage of World Population Using the Internet |
| July 2025 | 68.7% |
| July 2024 | 67.1% |
| Apr 2024 | 67.1% |
| Jan 2024 | 66.2% |
| Oct 2023 | 65.7% |
| Jul 2023 | 64.5% |
| 2022 | 62.5% |
| 2021 | 59.5% |
| 2020 | 59% |
| 2019 | 57% |
| 2018 | 53% |
| 2017 | 50% |
| 2016 | 46% |
Source: World Bank Group
The United States boasts a highly connected population. By the end of 2025, an estimated 327.18 million people in the U.S. will use the internet, covering 94.44% of the population. This number continues to climb, with projections reaching 337.67 million users by 2029.
| Year | Number of Internet Users in the US (Millions) |
| 2029* | 337.67 |
| 2028* | 335.23 |
| 2027* | 332.68 |
| 2026* | 330.01 |
| 2025 | 327.18 |
| 2024 | 324.16 |
| 2023 | 320.93 |
| 2022 | 317.52 |
| 2021 | 314.39 |
| 2020 | 311.62 |
*Projected numbers
Top Internet-Using Countries
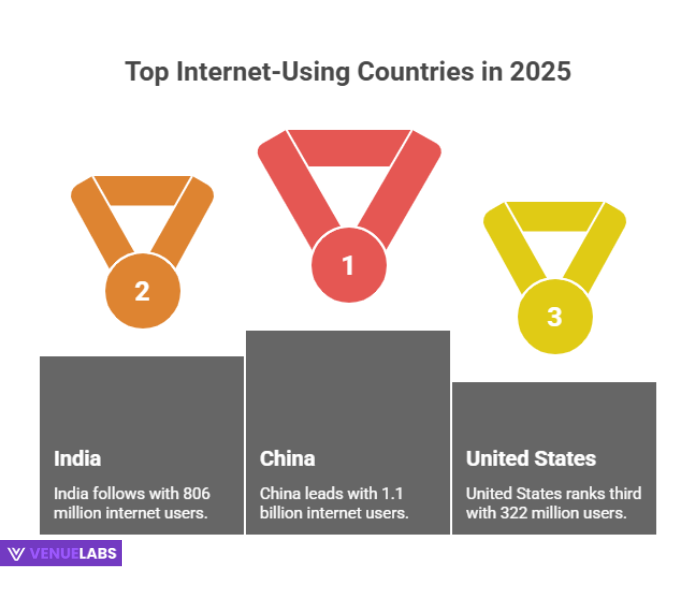
China leads the world with an astonishing 1.1 billion internet users in 2025. India follows closely with 806 million users, showcasing its massive and growing digital population. The United States ranks third globally.
| Country | Number of Internet Users (Millions) |
| China | 1,110 |
| India | 806 |
| United States | 322 |
| Indonesia | 212 |
| Brazil | 183 |
| Russia | 133 |
| Pakistan | 116 |
| Mexico | 110 |
| Japan | 109 |
| Nigeria | 107 |
Source: Statista
Global Internet Penetration Rates
Globally, the internet penetration rate reaches 67.9% as of February 2025. Northern Europe shows the highest penetration, with 97.9% of its population online. In contrast, Eastern Africa has the lowest rate, at just 28.5%.
| Region | Internet Penetration Rate |
| Northern Europe | 97.5% |
| Western Europe | 95.1% |
| Northern America | 93.3% |
| Southern Europe | 91.6% |
| Eastern Europe | 90.6% |
| Southern America | 83.2% |
| Central Asia | 80.8% |
| Central America | 79.2% |
| Eastern Asia | 78.5% |
| South-Eastern Asia | 78.2% |
| Oceania | 77.5% |
| Southern Africa | 77.0% |
| Western Asia | 75.9% |
| Northern Africa | 73.0% |
| Caribbean | 69.8% |
| Southern Asia | 53.8% |
| Western Africa | 42.5% |
| Middle Africa | 33.6% |
| Eastern Africa | 28.5% |
Time Spent Online
People spend a significant amount of time online. The typical internet user logs around 6 hours and 36 minutes each day. This marks a slight increase from previous quarters, showing how integrated the internet has become in our daily routines.
While time spent online peaked during the COVID-19 pandemic, it remains consistently high.
| Quarter | Average Time Spent Using the Internet |
| Q2 2024 | 6 hours 36 minutes |
| Q1 2024 | 6 hours 31 minutes |
| Q4 2023 | 6 hours 35 minutes |
| Q3 2023 | 6 hours 40 minutes |
| Q2 2023 | 6 hours 41 minutes |
| Q1 2023 | 6 hours 40 minutes |
| Q4 2022 | 6 hours 35 minutes |
| Q3 2022 | 6 hours 36 minutes |
| Q2 2022 | 6 hours 37 minutes |
| Q1 2022 | 6 hours 49 minutes |
Device Usage: Mobile Dominance
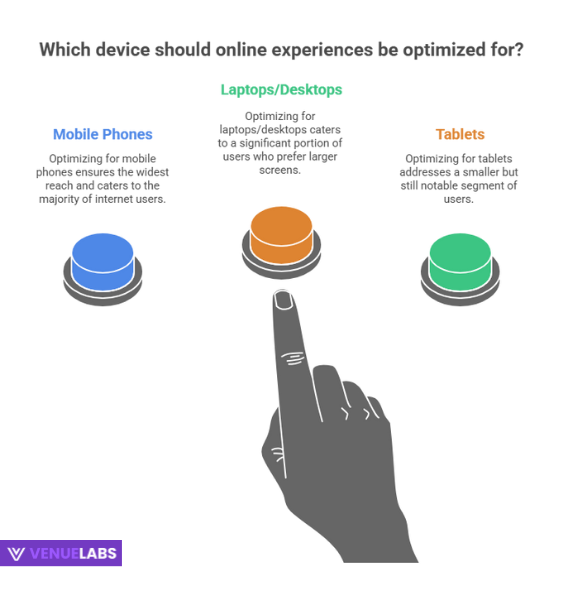
Mobile phones are the primary way people access the internet. A remarkable 95.9% of internet users worldwide use mobile phones to go online.
This compares to 62.2% who use laptops or desktops and 27.6% who use tablets. This mobile-first trend highlights the importance of optimizing online experiences for smaller screens.
| Device | Share of Internet Users |
| Mobile phone (any) | 95.9% |
| Smartphone | 93.7% |
| Laptop or desktop (any) | 62.2% |
| Personal laptop or desktop | 54% |
| Connected television | 31.6% |
| Work laptop or desktop | 27.7% |
| Tablet device | 27.6% |
| Smart home device | 18.1% |
| Games console | 11.5% |
| Feature phone | 4.5% |
| Virtual reality device | 4.4% |
In the United States, mobile internet usage is also soaring, with 308.67 million people accessing the internet via their phones in 2024. This number projects to reach 324.25 million by 2029.
On average, people spend 4 hours and 49 minutes daily on their mobile phones for internet use. This translates to over 33 hours per week. Mobile devices now generate 54.67% of all web traffic.
| Year | Number of Mobile Internet Users in the US (Millions) |
| 2029* | 324.25 |
| 2028* | 321.85 |
| 2027* | 319.35 |
| 2026* | 316.74 |
| 2025 | 314.01 |
| 2024 | 308.67 |
| 2023 | 294.55 |
| 2022 | 279.85 |
| 2021 | 264.75 |
| 2020 | 255.95 |
*Projected numbers
- Also read about: iPhone Users Statistics
Demographics of Internet Users
The internet reaches a broad demographic. Globally, 64.4% of the female population and 69.8% of the male population use the internet, showing a slight gender gap that is slowly closing.
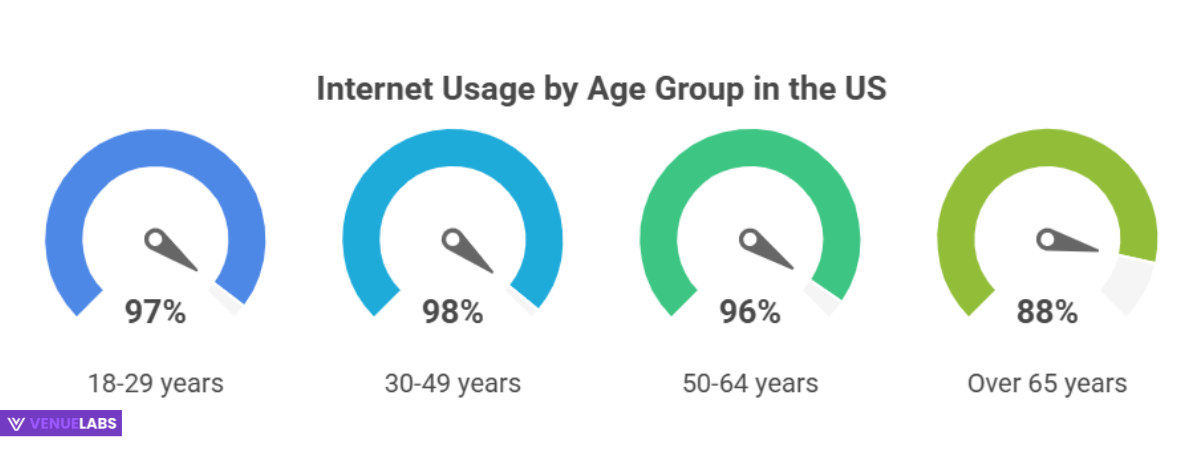
In the United States, internet usage is nearly universal for adults under 65. Almost all adults aged 30-49 (98%) are online. Even among those over 65, 88% use the internet.
| Age Group | Share of Internet Users in the US |
| 18-29 years | 97% |
| 30-49 years | 98% |
| 50-64 years | 96% |
| Over 65 years | 88% |
Search Engine Dominance
Search engines remain a crucial gateway to online information. Each month, 81.8% of internet users turn to search engines. Google firmly holds the top spot, dominating the global search engine market with a 90.48% share. Bing comes in a distant second with 3.93%.
This strong preference for Google extends to mobile search, where it commands 94.69% of the market.
Every single day, Google processes 16.4 billion searches, translating to 190,000 searches per second.
Visual searches are also on the rise, with Google Lens used for 8 billion visual searches monthly. Voice searches are increasingly popular, exceeding 1 billion per month.
- Also Read about: Google Searches Statistics
Social Media Landscape
Social media platforms are an integral part of internet usage. A staggering 95.9% of global internet users actively engage with social media. This means 5.41 billion people worldwide use social media, accounting for 66.4% of the total population. On average, users spend 2 hours and 40 minutes daily on these platforms.
| Year | Number of Social Media Users (Billions) |
| 2025 | 5.41 |
| 2024 | 5.22 |
| 2023 | 4.90 |
| 2022 | 4.59 |
| 2021 | 4.26 |
| 2020 | 3.9 |
| 2019 | 3.51 |
| 2018 | 3.1 |
| 2017 | 2.73 |
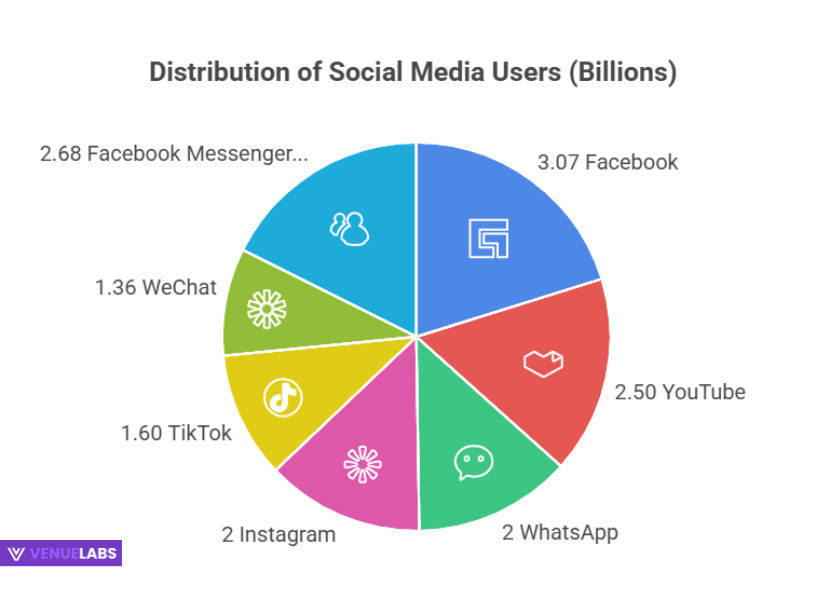
Facebook remains the largest social media platform with 3.07 billion users. YouTube follows with 2.50 billion, and WhatsApp and Instagram each boast 2 billion users. TikTok is also a major player with 1.60 billion users.
| Social Media Platform | Number of Users (Billions) |
| 3.07 | |
| YouTube | 2.50 |
| 2 | |
| 2 | |
| TikTok | 1.60 |
| 1.36 | |
| Facebook Messenger | 0.977 |
| Telegram | 0.900 |
| Snapchat | 0.800 |
In the United States, approximately 253 million people use social media, representing 70.1% of the country’s internet users.
India’s Digital Surge in 2026
India presents a dynamic and rapidly expanding digital landscape. In early 2025, India had 1.12 billion cellular mobile connections, equating to 76.6% of its population.
While many individuals have multiple connections, this highlights the widespread access to mobile networks. Importantly, 92.3% of these mobile connections are considered “broadband” (3G, 4G, or 5G), enabling faster internet access.
India is home to 806 million internet users as of January 2025, meaning 55.3% of its total population is online. This represents a significant increase of 49 million new internet users between January 2024 and January 2025. Despite this growth, 652 million people in India still remain offline.
Internet connection speeds in India are also improving. In early 2025, the median mobile internet download speed was 100.78 Mbps, and the median fixed internet download speed reached 63.55 Mbps. Both speeds show healthy increases compared to the previous year.
Social Media in India
Social media is incredibly popular in India, with 491 million active social media user identities in January 2025. This figure represents 33.7% of India’s total population.
YouTube leads the pack in India, with 491 million users in early 2025. This means YouTube ads can reach 60.9% of India’s internet user base. The platform saw a growth of 29 million users in India between early 2024 and 2025.
Facebook also has a substantial presence, with 384 million users in India in early 2025. Its ad reach covers 47.6% of the local internet user base. Facebook’s potential ad reach increased by 16.7 million users in India over the past year.
Instagram shows strong growth in India, with 414 million users in early 2025. Its ad reach extends to 51.4% of the local internet user base. Instagram’s potential ad reach in India grew by an impressive 51 million users between January 2024 and January 2025.
Other platforms also see significant use:
- LinkedIn: 150 million members in India, with a 25% growth over the past year.
- Messenger: 109 million users in India.
- Snapchat: 208 million users in India, growing by 7.07 million over the last year.
- X (formerly Twitter): 24.1 million users in India.
New Trends and User Questions (from Quora/Reddit):
Many users on platforms like Quora and Reddit frequently ask about the practical implications of these internet usage statistics. They want to know:
- How do I protect my privacy with so much time spent online?
- Users are increasingly concerned about data security given the sheer volume of personal information shared online.
- What are the best strategies for digital well-being when everyone is online all the time?
- People recognize the need to manage their online time effectively to avoid burnout and maintain mental health.
- How can small businesses in developing regions like parts of India leverage this growing internet access?
- Entrepreneurs seek actionable advice on reaching the newly connected populations, especially with the dominance of mobile internet.
- What is the impact of AI on internet usage and search engines?
- Users wonder if AI tools will change how they search for information and interact with online content.
- Are there noticeable shifts in content consumption towards short-form video or live streaming?
- The rise of TikTok and similar platforms sparks curiosity about evolving entertainment habits.
How You Can Benefit from These Statistics:
Understanding these internet usage statistics empowers you to make informed decisions.
- For Individuals: You can better manage your own online time, understand global trends, and recognize the widespread influence of digital platforms. Being aware of mobile dominance means you can prepare for more mobile-centric services.
- For Businesses: These statistics are invaluable for marketing and strategy. If your target audience is in India, focusing on mobile-first content and platforms like YouTube, Instagram, and Facebook is crucial. Knowing the prevalent search engine means you optimize your content for Google. Understanding age demographics helps you tailor your message to the right audience. The shift towards short-form video and live streaming signals opportunities for engaging content creation.
FAQs About Internet User Statistics
1. How many people use the internet globally in 2025?
In 2025, approximately 5.65 billion people across the world actively use the internet, which accounts for 68.7% of the total global population, marking a significant increase in global connectivity.
2. Which countries have the most internet users?
China leads the world with the highest number of internet users, reaching 1.1 billion people, followed closely by India with 806 million users, and the United States holds the third position globally.
3. What devices do people use most to access the internet?
Mobile phones are the dominant device for internet access, with over 95.9% of internet users worldwide accessing the internet through their mobile devices, highlighting a mobile-first trend in digital consumption.
4. How much time do people spend online each day?
On average, internet users spend approximately 6 hours and 36 minutes online every day, a figure that remains high and demonstrates the deep integration of the internet into daily life, even after the peaks seen during the COVID-19 pandemic.
5. What is the "state of digital" in India in 2025?
India’s digital landscape in 2025 shows 806 million internet users, making up 55.3% of its population, along with 491 million social media users, indicating a rapidly growing online presence with significant mobile connectivity and improving internet speeds.
Also Read:
- Latest Digital Marketing Statistics
- Affiliate Marketing Statistics
- Video Marketing Statistics
- X Twitter Statistics
- CRM Statistics
Conclusion:
The internet continues to grow at an astonishing rate, connecting 5.65 billion people worldwide in 2025. This global digitalization, driven by widespread smartphone adoption and increasing accessibility, profoundly impacts how we live, work, and communicate.
Mobile devices are the primary gateway to the internet, and social media platforms engage billions daily. Countries like India are experiencing immense digital transformation, opening new avenues for connectivity and commerce.
By staying informed about these trends, individuals and businesses can navigate the evolving digital landscape effectively and harness its immense potent

Comments
Be the first to leave a comment.