
Uber dominates the global ride-hailing market, holding a staggering 76% market share. This massive presence means a world of opportunity for both riders seeking convenient transportation and individuals looking to earn income.
As we look at the number of Uber statistics 2025, we uncover the dynamic landscape of this giant platform and how you can leverage its growth.
In the first half of 2025 alone, Uber drivers completed an astounding 6.29 billion trips, generating a total revenue of $24.18 billion.
These figures are not just numbers; they represent millions of connections made, journeys completed, and livelihoods supported. Let’s delve deeper into these crucial statistics to understand Uber’s impact and potential.
Uber’s Expanding Reach: Users and Trips in 2026
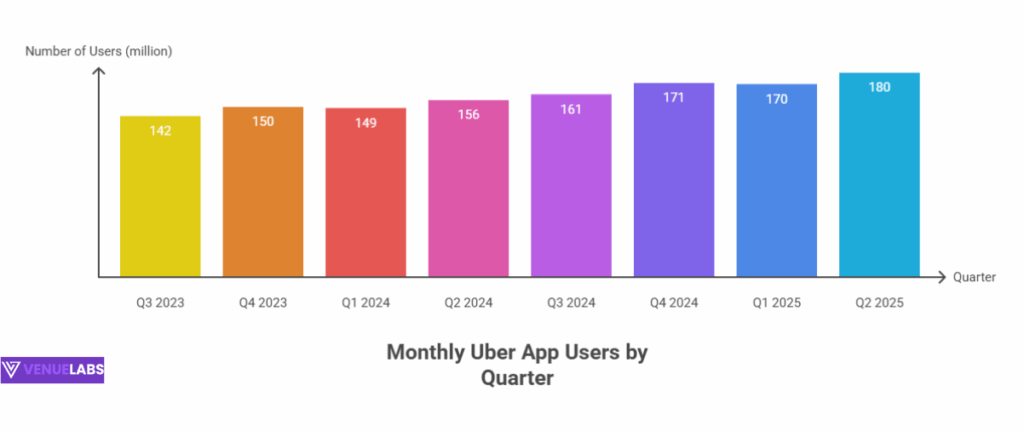
Uber continues to connect more people than ever. The platform now boasts 180 million monthly active users, marking a significant 15% year-over-year increase from 2024. This growth signifies a continuous demand for ride-hailing and delivery services, providing a robust ecosystem for drivers.
The number of people using Uber monthly has seen consistent growth, quarter after quarter. This steady increase in demand directly translates to more opportunities for drivers on the platform.
Number of Uber Users by Quarter:
| Quarters | Number Of People That Use The Uber App Monthly |
| Q2 2025 | 180 million |
| Q1 2025 | 170 million |
| Q4 2024 | 171 million |
| Q3 2024 | 161 million |
| Q2 2024 | 156 million |
| Q1 2024 | 149 million |
| Q4 2023 | 150 million |
| Q3 2023 | 142 million |
| Q2 2023 | 137 million |
| Q1 2023 | 130 million |
| Q4 2022 | 131 million |
| Q3 2022 | 124 million |
| Q2 2022 | 122 million |
| Q1 2022 | 115 million |
Source: Uber.
This upward trend in user numbers directly fuels the number of trips completed. In Q2 2025, Uber drivers facilitated 3.26 billion trips, building on the 3.03 billion trips from Q1 2025. Annually, Uber completed 11.27 billion trips in 2024, showing a remarkable 19% year-over-year growth.
- Also read about: Social Media Statistics
Uber Trips Completed Over the Past Years:

| Year | Number Of Trips |
| 2025 (Q1+Q2) | 6.29 billion |
| 2024 | 11.27 billion |
| 2023 | 9.44 billion |
| 2022 | 7.64 billion |
| 2021 | 6.36 billion |
| 2020 | 4.98 billion |
| 2019 | 6.9 billion |
| 2018 | 5.21 billion |
The sheer volume of trips highlights the constant demand for Uber’s services, creating a fertile ground for drivers.
The Growing Workforce: Number of Uber Drivers Statistics 2026
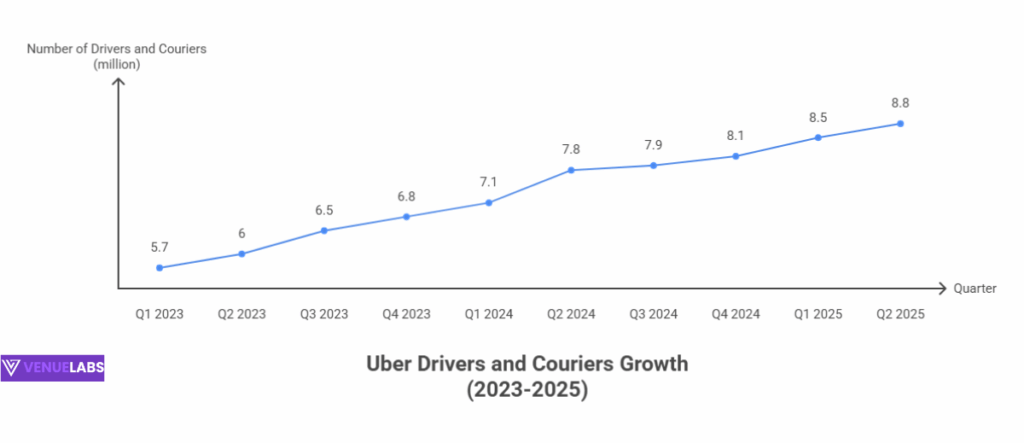
The core of Uber’s operations relies on its vast network of drivers and couriers. In Q2 2025, the number of Uber drivers globally reached over 8.8 million.
This represents a substantial 12.05% year-over-year growth compared to 7.8 million drivers in Q2 2024, demonstrating that more people are choosing Uber for flexible earning opportunities.
Number of Uber Drivers and Couriers by Quarter:
| Quarter | Uber Drivers And Couriers |
| Q1 2023 | 5.7 million |
| Q2 2023 | 6 million |
| Q3 2023 | 6.5 million |
| Q4 2023 | 6.8 million |
| Q1 2024 | 7.1 million |
| Q2 2024 | 7.8 million |
| Q3 2024 | 7.9 million |
| Q4 2024 | 8.1 million |
| Q1 2025 | 8.5 million |
| Q2 2025 | 8.8 million |
Source: Business of Apps
This continuous growth in the driver pool reflects both the platform’s ability to attract new talent and the ongoing need for its services.
Interestingly, among these 8.8 million drivers, 230,000 operate Zero Emission Vehicles (ZEV), showcasing Uber’s commitment to sustainability and offering new avenues for eco-conscious drivers. These ZEV drivers completed an impressive 105.5 million trips in Q1 2025.
Understanding Driver Earnings and Demographics
When considering becoming an Uber driver, earnings are a crucial factor. While individual earnings vary based on location, hours worked, and specific incentives, some general trends emerge.
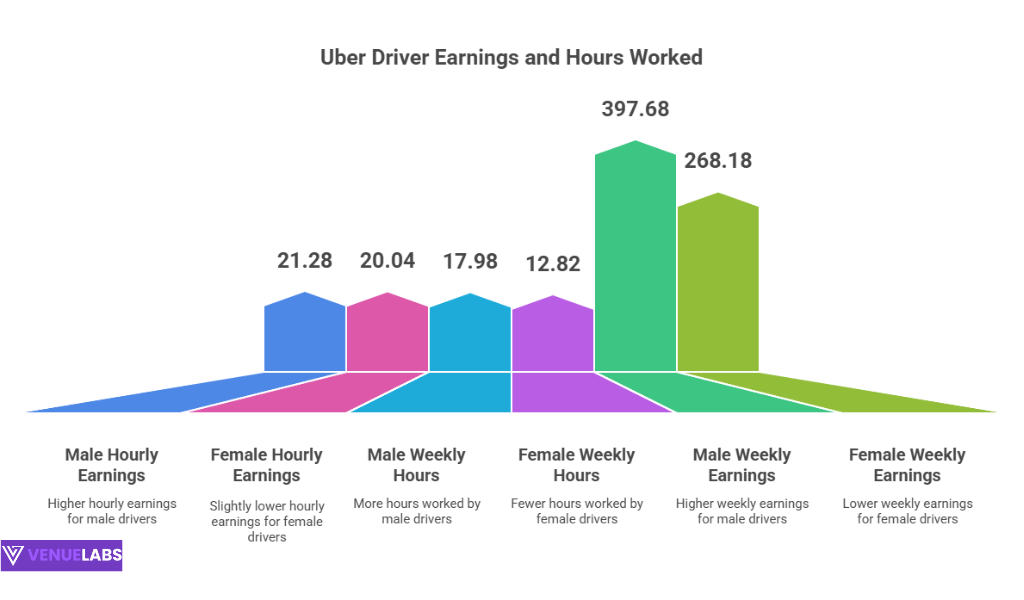
A Stanford Uber report reveals that male Uber drivers typically earn $21.28 per hour, while female Uber drivers earn $20.04 per hour.
This difference often relates to the number of hours worked, with male drivers averaging 17.98 hours per week compared to female drivers’ 12.82 hours per week.
This translates to an average weekly earning of $397.68 for male drivers and $268.18 for female drivers.
Looking at monthly earnings, the data from Earnest provides a clearer picture of income distribution among drivers:
Monthly Earnings Made by Uber Drivers:
| Earnings Made By Uber Driver | Percentage Of Uber Drivers |
| $0 to $99 | 45% |
| $100 to $499 | 39% |
| $500 to $999 | 11% |
| $1000 to $1499 | 4% |
| $1500 to $1999 | 2% |
| $2000+ | 0% |
This distribution shows that a significant portion of Uber drivers use the platform for supplemental income, earning less than $500 monthly. However, a smaller but substantial group earns more, highlighting the flexibility the platform offers to fit various financial goals.
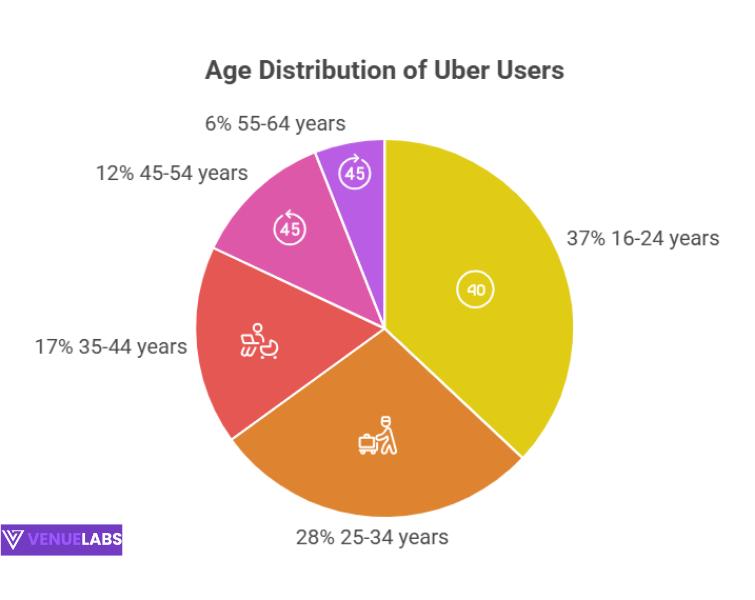
The demographics of Uber users are also insightful. In the United States, 52% of Uber users are male, and 48% are female. The largest age group of users falls between 16 and 24 years old, making up 37% of the user base, followed by 28% in the 25-34 age bracket.
Age Group of Uber Users:
| Age Group | Percentage Of Uber Users |
| 16 to 24 years | 37% |
| 25 to 34 years | 28% |
| 35 to 44 years | 17% |
| 45 to 54 years | 12% |
| 55 to 64 years | 6% |
Suburban areas account for the highest percentage of Uber users in the US at 48%, slightly more than urban regions at 46%, with rural areas making up 6%. This broad geographical usage reinforces the widespread demand for Uber drivers across diverse environments.
- Also read about: Android Statistics
Financial Performance: Bookings, Revenue, and Profit
Uber’s financial health directly impacts the stability and opportunities for its drivers. The platform continues to show robust financial performance.
In Q2 2025, Uber’s gross bookings amounted to $46.7 billion, representing a 17% year-over-year increase. For the entire year of 2024, gross bookings reached $162.7 billion, a significant jump from $137.8 billion in 2023.
Gross Booking of Uber Over the Past Years:
| Year | Gross Booking Of Uber |
| 2025 (Q1+Q2) | $89.5 billion |
| 2024 | $162.7 billion |
| 2023 | $137.8 billion |
| 2022 | $115.3 billion |
| 2021 | $90.4 billion |
| 2020 | $57.8 billion |
| 2019 | $65 billion |
Revenue generation also shows a strong upward trend. In the first half of 2025, Uber generated $24.18 billion in revenue. For the full year 2024, Uber’s revenue was $43.97 billion, an 18% increase from 2023.
Net Revenue Generated by Uber Over the Past Years:
| Year | Net Revenue Generated By Uber |
| 2025 (Q1+Q2) | $24.18 billion |
| 2024 | $43.97 billion |
| 2023 | $37.28 billion |
| 2022 | $31.87 billion |
| 2021 | $17.45 billion |
| 2020 | $11.13 billion |
| 2019 | $13 billion |
| 2018 | $11.3 billion |
| 2017 | $7.5 billion |
| 2016 | $6.5 billion |
Uber’s Mobility segment (ride-hailing) remains its primary revenue driver, contributing $13.78 billion in the first half of 2025. The Delivery segment (Uber Eats) also makes a significant contribution at $7.8 billion, followed by Freight at $2.5 billion.
After years of significant losses, Uber recorded a net profit of $9.8 billion in 2024, a substantial turnaround from previous years. This financial stability ensures the company can continue investing in its platform, supporting its drivers, and expanding its services.
Market Dominance and Brand Awareness
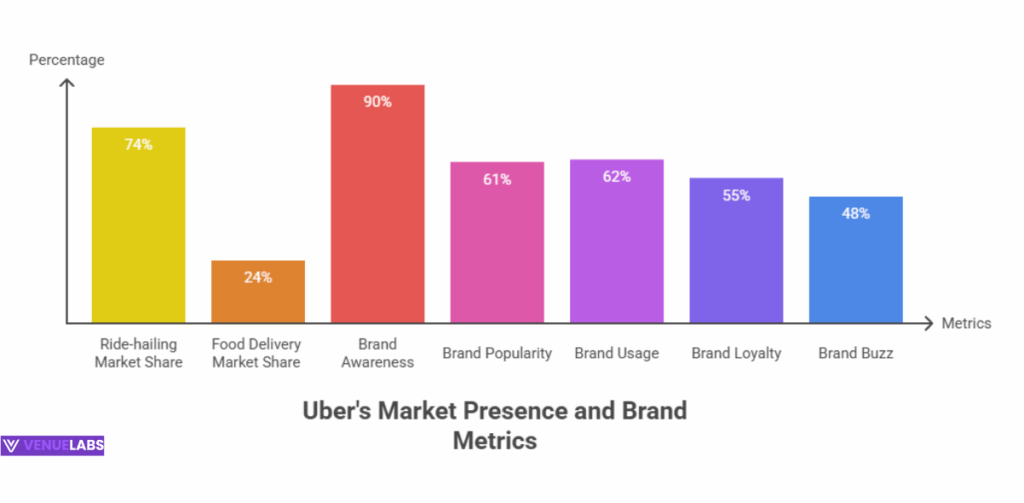
Uber holds a commanding 74% of the ride-hailing market share in the United States, far surpassing its closest competitor, Lyft (26%). This dominant position means that a vast majority of riders seeking transportation services will turn to Uber, ensuring consistent demand for drivers.
Beyond ride-hailing, Uber Eats maintains a strong presence in the food delivery market with a 24% share, second only to DoorDash. This diversified portfolio allows drivers to switch between ride-hailing and food delivery, optimizing their earning potential based on demand.
Uber’s brand awareness stands at an impressive 90%, highlighting its widespread recognition and trust among consumers. This strong brand presence translates into a continuous stream of users, which directly benefits the number of Uber drivers who rely on consistent demand.
Brand Awareness, Usage, Popularity, and Buzz Among Mobility Service Users:
| Brand Awareness | Percentage |
| Uber awareness | 90% |
| Uber popularity | 61% |
| Uber usage | 62% |
| Uber loyalty | 55% |
| Uber buzz | 48% |
What’s New: Insights from Quora and Reddit for Drivers
Beyond the statistics, real-world experiences shared on platforms like Quora and Reddit offer valuable insights for current and prospective Uber drivers. Users frequently ask about:
- Maximizing Earnings: Drivers are always looking for tips on increasing their income. Common advice includes driving during peak hours (commutes, weekends, late nights), strategically positioning themselves in high-demand areas (airports, event venues, downtowns), and utilizing surge pricing effectively. Many discuss the benefits of driving for both Uber and Uber Eats to capitalize on different demand patterns.
- Vehicle Maintenance and Expenses: New drivers often inquire about the hidden costs of driving, such as fuel, maintenance, insurance, and depreciation. Discussions emphasize the importance of choosing fuel-efficient vehicles and meticulously tracking expenses for tax purposes. Some drivers share their experiences with electric vehicles and the cost savings on fuel.
- Driver Support and Safety: Drivers frequently discuss the quality of Uber’s driver support and safety features. Concerns often revolve around unfair deactivations, rider behavior, and the need for better in-app safety tools. Uber’s ongoing efforts to enhance safety features and improve driver support are a constant topic.
- Navigating Incentives and Promotions: Drivers want to understand how to best take advantage of Uber’s incentives, quests, and promotions. Tips often involve understanding the terms and conditions, aiming for completion bonuses, and sometimes strategically declining low-paying rides to qualify for better incentives.
- Work-Life Balance and Flexibility: The flexibility of Uber driving is a major draw, and drivers share their experiences in balancing driving with other commitments. Many appreciate the ability to set their own hours, but also acknowledge the self-discipline required to earn consistently.
These discussions highlight that while the statistics paint a broad picture, the day-to-day experience of an Uber driver involves active strategy, cost management, and engagement with the platform’s features to maximize personal benefit.
Uber’s Investments: Memberships, Expenditures, and Acquisitions
Uber continues to invest in its growth and ecosystem. The Uber One membership, launched in August 2020, now boasts over 5 million members across 16 countries.
These members enjoy discounts on rides and deliveries, along with free delivery on certain transactions, creating a loyal customer base that further supports driver demand.
The company’s expenditures reflect its aggressive growth strategy. In the first half of 2025, Uber’s costs and expenses reached $21.5 billion, with total expenses hitting an all-time high of $41.17 billion in 2024.
A significant portion of this goes towards advertising, with $1.9 billion spent in 2024 to maintain its strong brand awareness and attract new users and drivers.
Uber also expands its reach through strategic acquisitions, having acquired 19 companies, mostly in the United States. Recent acquisitions in 2025 include Dantaxi and Crowntaxi, further solidifying its presence in various markets.
These acquisitions often integrate new technologies or expand service offerings, indirectly benefiting drivers through a broader ecosystem and increased opportunities.
Uber Eats: A Parallel Growth Story
Uber Eats has become a massive force in the delivery sector, now available in over 10,500 cities across 70 countries. Its growth has been explosive, especially since 2020, expanding from 1,000 cities to 6,000 in that year alone. This vast reach provides abundant opportunities for couriers.
Number of Cities Where Uber Eats Is Available:
| Year | Number Of Cities In Which Uber Eats Is Available |
| 2023 | 10,500 |
| 2022 | 10,000 |
| 2021 | 6,000 |
| 2020 | 1,000 |
| 2019 | 500 |
| 2018 | 200 |
| 2017 | 120 |
The platform has also fostered extensive partnerships with restaurants, reaching 825,000 by the end of 2022. This extensive network means couriers have a wide variety of orders available, catering to diverse customer preferences.
Number of Restaurants Uber Eats Partnered With:
| Year | Number Of Restaurants Uber Had Partnered With |
| 2022 | 825,000 |
| 2021 | 900,000 |
| 2020 | 600,000 |
| 2019 | 220,000 |
| 2018 | 100,000 |
| 2017 | 80,000 |
FAQs About Uber Statistics
1. How many Uber drivers are there globally in 2025?
As of Q2 2025, there are over 8.8 million Uber drivers and couriers operating across the globe, showing a significant increase from previous years.
2. What are the typical earnings for an Uber driver?
Earnings vary, but according to a Stanford Uber report, male drivers earn around $21.28 per hour and female drivers around $20.04 per hour. Monthly earnings data suggests many drivers use Uber for supplemental income, with 45% earning
3. What is the demand like for Uber drivers?
The demand for Uber drivers is consistently high, evidenced by 180 million monthly active users and 3.26 billion trips completed in Q2 2025 alone. Uber’s strong market share in ride-hailing and Uber Eats ensures a continuous flow of opportunities.
4. Can I drive for Uber if I have an electric vehicle?
Yes, Uber actively supports electric vehicles. Out of the 8.8 million drivers, 230,000 already operate Zero Emission Vehicles (ZEVs), completing 105.5 million trips in Q1 2025. This indicates a growing trend and potential benefits for ZEV drivers.
5. How can new Uber drivers maximize their earnings?
New drivers can maximize earnings by strategically driving during peak demand times (rush hours, weekends, events), utilizing surge pricing in busy areas, and potentially combining ride-hailing with Uber Eats deliveries. Learning about and participating in Uber’s incentives and promotions also helps boost income.
Also Read:
- Amazon Statistics
- Pinterest Statistics
- Microsoft Teams Statistics
- Snapchat Statistics
- Google Chrome Statistics
Conclusion: Driving Towards Opportunity with Uber in 2026
The number of Uber drivers statistics 2025 clearly show a vibrant and expanding platform. With 180 million active monthly users and a driver base of 8.8 million, Uber continues to lead the mobility and delivery sectors.
The significant growth in trips, gross bookings, and revenue, coupled with the platform’s return to profitability, creates a stable and promising environment.
For individuals seeking flexible work, Uber offers a compelling opportunity. The continuous demand, driven by strong brand awareness and a vast user base, ensures that drivers have consistent earning potential.
By understanding these statistics and leveraging insights from the driver community, you can strategically navigate the Uber platform to maximize your benefits, whether you are looking for supplemental income or a primary source of earnings.
The future of mobility is here, and Uber is driving it forward, inviting you to be a part of the journey.


Comments
Be the first to leave a comment.