Facebook continues to be a giant in the social media world, and understanding its latest statistics for 2025 is key to making it work for you.
Whether you’re a business owner, a marketer, or just curious about how this massive platform operates, we’ve got you covered.
We’ll dive deep into user numbers, engagement trends, business opportunities, and even the exciting role of AI, all explained in simple language to help you benefit.
How Many People Are Using Facebook in 2026?
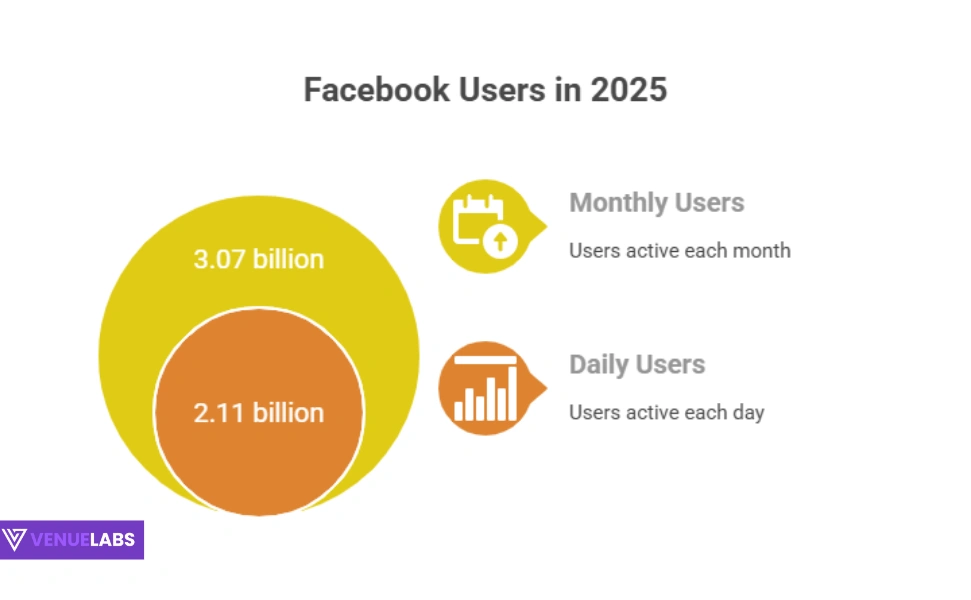
Facebook’s reach is truly global and continues to grow. In 2025, the platform proudly boasts 3.07 billion monthly active users (MAUs) worldwide.
This is a solid increase from previous years, showing Facebook’s enduring power. To put it in perspective, out of all the social media users globally (which is about 5.17 billion!), Facebook captures nearly 60% of that audience. This means a huge potential for you to connect with people.
Think about it: more than two-fifths of the world’s population logs into Facebook every month!
This incredible growth isn’t new; Facebook has seen its monthly active users more than double in the last decade, growing a whopping 120.86% since 2014.
Facebook Monthly Active Users Over The Years
Let’s look at how Facebook’s monthly active users have grown over time:
| Year | Users |
| 2025 | 3.07 billion |
| 2024 | 3.65 billion |
| 2023 | 3.65 billion |
| 2022 | 2.96 billion |
| 2021 | 2.91 billion |
| 2020 | 2.80 billion |
| 2019 | 2.50 billion |
| 2018 | 2.32 billion |
| 2017 | 2.13 billion |
| 2016 | 1.86 billion |
| 2015 | 1.59 billion |
| 2014 | 1.39 billion |
Source: Statista
Not only are people logging in every month, but a huge number are also using the platform daily. Facebook has over 2.11 billion daily active users (DAUs) in 2025.
This means that nearly 70% of its monthly users check in every single day! This consistent engagement highlights Facebook’s central role in people’s daily lives.
Facebook Daily Active Users Over The Years
Here’s how daily active users have stacked up:
| Year | Facebook Daily Active Users |
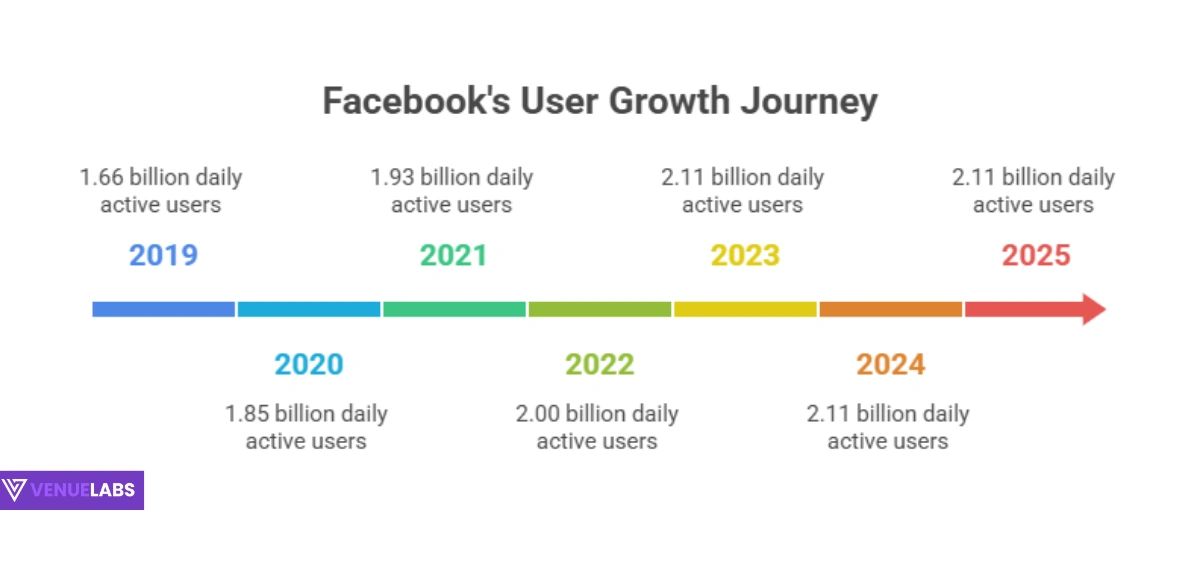
| 2025 | 2.11 billion |
| 2024 | 2.11 billion |
| 2023 | 2.11 billion |
| 2022 | 2.00 billion |
| 2021 | 1.93 billion |
| 2020 | 1.85 billion |
| 2019 | 1.66 billion |
| 2018 | 1.52 billion |
| 2017 | 1.40 billion |
| 2016 | 1.23 billion |
This consistent daily usage means your messages and content have a high chance of being seen regularly.
- Also read about: Social Media Statistics
How Does Facebook Stack Up Against Other Platforms?
It’s clear that Facebook is huge on its own, but many users don’t stick to just one platform. People often use Facebook alongside other popular social media apps.
- Instagram: A staggering 77.6% of Facebook users also use Instagram. Since both are owned by Meta, this synergy offers unique cross-promotion opportunities.
- YouTube: 73.4% of Facebook users also watch videos on YouTube.
- WhatsApp: 72.9% of Facebook users also connect through WhatsApp, another Meta-owned platform.
- TikTok: More than half (52.1%) of Facebook users also enjoy short-form videos on TikTok.
- Twitter (X): 37.0% of Facebook users also use Twitter.
- Pinterest: 34.0% of Facebook users also browse and share ideas on Pinterest.
This overlap suggests that a multi-platform strategy can effectively reach your target audience. You might find similar users on different apps, allowing you to tailor your content for each platform while reaching the same core group.
Facebook’s Global Footprint: Users by Country
While Facebook is a global phenomenon, some countries contribute significantly more to its user base. India takes the lead with an astounding 581.6 million users. This massive audience makes India a critical market for anyone looking to expand their reach.
The United States, where Facebook was born, comes in second with 279.8 million users. Despite its smaller population compared to India, the U.S. remains a vital market due to its high engagement and economic influence.
Top Countries by Facebook Audience (2025 Estimates)
Here’s a look at the top 15 countries with the most Facebook users and their gender breakdown:
| Rank | Country | Users (Millions) | % of Population Using Facebook | Male Users (%) | Female Users (%) |
| 1 | India | 581.6 | 40.08% | 31.5% | 68.5% |
| 2 | United States | 279.8 | 81% | 53.8% | 46.2% |
| 3 | Brazil | 175.1 | 82.6% | 55.3% | 44.7% |
| 4 | Indonesia | 174 | 61.38% | 46.2% | 53.8% |
| 5 | Mexico | 111.4 | 85.13% | 52.1% | 47.9% |
| 6 | Philippines | 102.3 | 88.32% | 53% | 47% |
| 7 | Vietnam | 86.1 | 85.27% | 51.1% | 48.9% |
| 8 | Russia | 70.6 | 48.76% | 58.9% | 41.1% |
| 9 | Turkey | 70.3 | 80.37% | 43.7% | 56.3% |
| 10 | Bangladesh | 67.2 | 38.71% | 35.3% | 64.7% |
| 11 | Japan | 61.7 | 49.86% | 55.9% | 44.1% |
| 12 | Pakistan | 60.4 | 24.05% | 23.5% | 76.5% |
| 13 | Thailand | 58.3 | 81.35% | 52.3% | 47.7% |
| 14 | Egypt | 56.4 | 48.4% | 40.1% | 59.9% |
| 15 | United Kingdom | 55.9 | 80.86% | 53.3% | 46.7% |
Notice the variations:
- High Penetration: The Philippines leads with an astonishing 88.32% of its population using Facebook.
- Gender Skew: In Pakistan, women make up the majority of users at 76.5%, while in Russia, men are more prevalent at 58.9%. These differences are crucial for targeted campaigns.
Facebook Users in the United States
The U.S. continues to be a powerhouse for Facebook. Projections show its user base steadily growing.
| Year | Facebook Users In The US |
| 2028* | 262.8 million |
| 2027* | 259.86 million |
| 2026* | 256.78 million |
| 2025 | 279.8 million |
| 2024 | 250.2 million |
| 2023 | 246.73 million |
| 2022 | 243.24 million |
| 2021 | 239.96 million |
| 2020 | 235.36 million |
| 2019 | 223.42 million |
| *ProjectedNumbers |
Who Is Using Facebook? Demographics 2025
Understanding who uses Facebook helps you tailor your content effectively. Let’s break down user age and gender.
Facebook User Gender Demographics
Globally, Facebook leans slightly more male: 55.26% of users are male, while 44.74% are female. This slight skew is important to consider when you’re crafting messages for a specific audience.
Facebook User Age Demographics
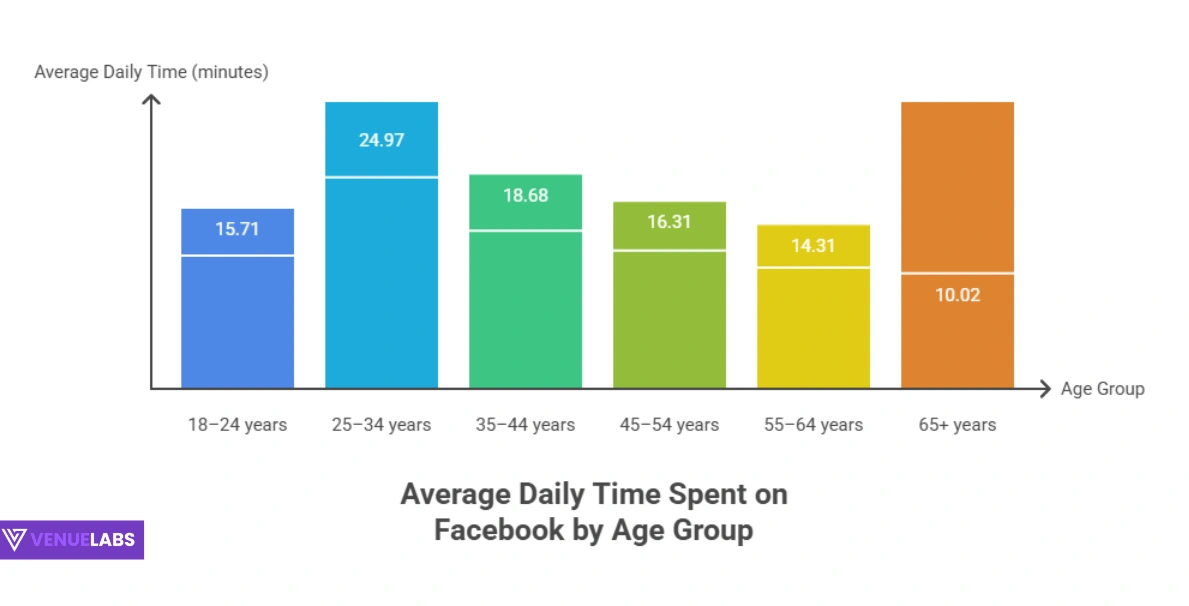
Facebook has a broad appeal, but some age groups are more active than others. The largest segment, at 24.97%, is users aged 25 to 34 years old. This group represents young adults who are actively building careers, families, and social lives, making them a highly engaged audience.
The second-largest group includes those aged 35 to 44 years, making up 18.68% of the audience.
Here’s a detailed look at global age distribution:
| Age Group | Share Users |
| 18 to 24 years | 15.71% |
| 25 to 34 years | 24.97% |
| 35 to 44 years | 18.68% |
| 45 to 54 years | 16.31% |
| 55 to 64 years | 14.31% |
| Over 65 years | 10.02% |
Facebook Age Demographics in the United States
The age distribution in the U.S. mirrors global trends closely:
| Age Group | Percentage Of Facebook Users |
| 18 to 24 years | 18.6% |
| 25 to 34 years | 24.2% |
| 35 to 44 years | 19% |
| 45 to 54 years | 14.2% |
| 55 to 64 years | 11.7% |
| 65 and over | 12.3% |
Interestingly, the oldest age group (65 and over) shows higher engagement than the 55-64 group in the US, indicating Facebook’s continued relevance across generations.
Downloads and Device Usage: How People Access Facebook
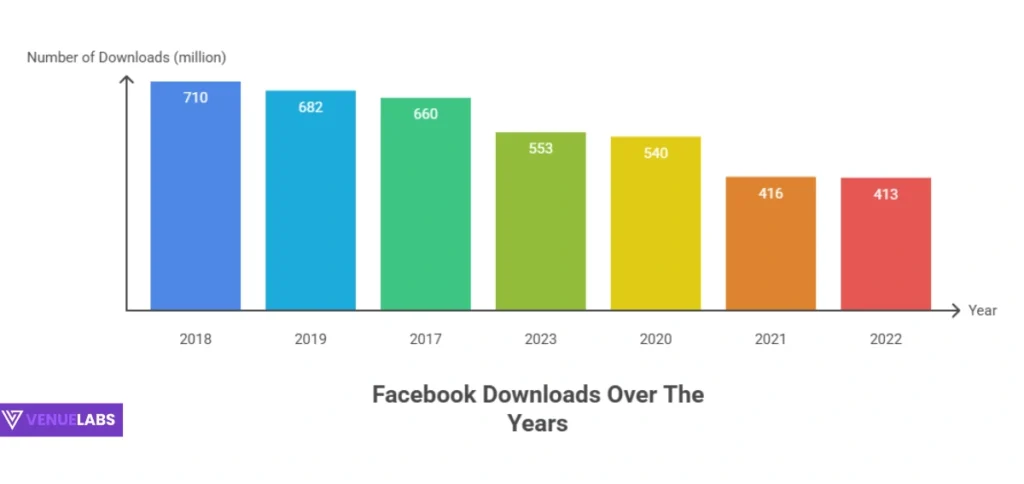
Facebook isn’t just popular; it’s incredibly accessible. The app has been downloaded over 5 billion times from the Google Play Store alone, a truly astonishing number.
In 2023, it saw 553 million new downloads, proving its ongoing appeal. It even ranked as the fourth most downloaded social media app on iPhones and second on iPads, showing its strong presence across Apple devices too.
Facebook Downloads Over The Years
| Year | Downloads |
| 2023 | 553 million |
| 2022 | 413 million |
| 2021 | 416 million |
| 2020 | 540 million |
| 2019 | 682 million |
| 2018 | 710 million |
| 2017 | 660 million |
How Users Access Facebook
The shift to mobile-first is undeniable. A significant 52.66% of Facebook users only use their phones to access the platform. However, nearly half (47.34%) still prefer using a desktop.
In the U.S., the mobile dominance is even more pronounced:
| Device | Share of Users |
| Any kind of mobile device | 98.5% |
| Laptop or Desktop | 1.5% |
| Both phones and computers | 16.7% |
| Only via a mobile phone | 81.8% |
This data strongly suggests that your content must be mobile-optimized to effectively reach the vast majority of your audience.
Engagement on Facebook: How Long Do People Stay?
Facebook users spend a good amount of time on the platform, averaging 10 minutes and 12 seconds per session. This might seem short, but remember people check Facebook multiple times a day.
When we look at daily usage, the numbers become even more interesting:
- Users aged 55 to 64 spend the most time, averaging 45 minutes per day. This is a powerful insight for businesses targeting older demographics.
- The youngest group, 18 to 24-year-olds, spend less time, averaging 22 minutes. This suggests they might be splitting their time across multiple platforms.
- Users in the 35 to 44 age group spend a solid 30 minutes daily.
Average Time Spent On Facebook by Age Group
| Age Group | Average Time Spent On Facebook |
| 18 to 24 years | 22 minutes |
| 25 to 34 years | 26 minutes |
| 35 to 44 years | 30 minutes |
| 45 to 54 years | 36 minutes |
| 55 to 64 years | 45 minutes |
| Over 65 years | 34 minutes |
Globally, users spend about 18 hours and 45 minutes per month on Facebook’s Android app. Interestingly, users in the UAE are Facebook’s biggest fans, clocking in an average of 31 hours and 8 minutes each month!
Content and Engagement Rates: What Works Best?
Facebook pages post frequently, averaging about 1.75 posts per day. What kind of content do they share?
- Link posts are surprisingly popular, making up 42.9% of all content.
- Photo posts are a strong second, accounting for 34.3%.
- Video posts are also significant at 19.3%.
- Status updates are less common, at just 3.5%.
But sharing content is one thing; getting people to interact with it is another.
Facebook Page Post Engagement Rates
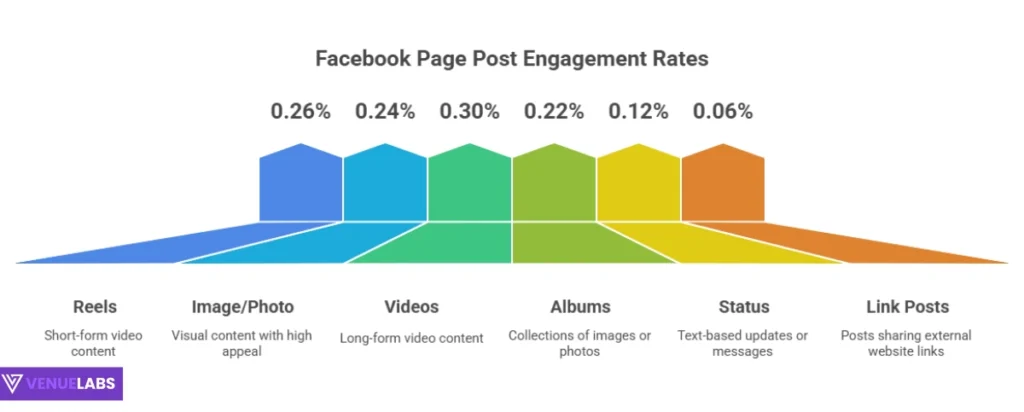
Here’s how different content types perform in terms of engagement:
| Post Type | Average Fan Engagement Rate |
| Reels | 0.26% |
| Image/Photo | 0.24% |
| Videos | 0.30% |
| Albums | 0.22% |
| Status | 0.12% |
| Link Posts | 0.06% |
Notice that videos have the highest engagement rate at 0.30%, closely followed by Reels at 0.26%. This tells you that dynamic, visual content captures attention most effectively.
Link posts, despite being frequently shared, have the lowest engagement. This suggests that while links drive traffic, they don’t always spark direct interaction on Facebook itself.
Why Do People Use Facebook?
Understanding user motivation is crucial for crafting compelling content. The top reasons people use Facebook are:
- Messaging friends and family: A whopping 72.4% use it primarily for communication.
- Sharing photos and videos: 63.2% enjoy posting and viewing visual content.
- Looking for funny or entertaining content: 54.7% come to Facebook for entertainment.
- Following or researching brands and products: 53.0% use Facebook to connect with businesses.
- Keeping up with news and current events: 8.2% use it for news consumption.
Top Reasons People Use Facebook
| Reason | Percentage of People |
| Message friends and family | 72.4% |
| Post or share photos or videos | 63.2% |
| Keep up to date with news and current events | 8.2% |
| Look for funny or entertaining content | 54.7% |
| Follow or research brands and products | 53.0% |
This data clearly shows that Facebook is a hub for personal connections, entertainment, and increasingly, discovery and interaction with brands.
Facebook for Businesses: Opportunities Galore
Facebook isn’t just for connecting with friends; it’s a powerful tool for businesses. Over 200 million companies already use Facebook’s applications and free tools to grow their presence.
- Sales Impact: In the past year, 18.3% of American adults made a purchase directly on Facebook. This highlights its growing role as an e-commerce platform.
- Local Business Visits: More than 70% of Facebook users visit a local business page at least once a week. This is fantastic news for small and local businesses.
- Customer Service: Using Facebook live chat makes customers 53% more likely to buy from a company. This shows the power of immediate and direct communication.
- Global Reach with AI: Facebook is introducing real-time translation for hundreds of languages. This means businesses can create content in one language and trust Facebook to translate it accurately for a global audience, leading to wider engagement and more international customers.
The bottom line for businesses: Facebook offers immense opportunities for advertising, customer engagement, and direct sales.
Facebook Ad Statistics
Facebook’s advertising platform is a significant revenue driver. In 2024, 97.5% of Facebook’s total revenue came from advertising, amounting to $160.38 billion. More than 10 million advertisers actively run campaigns on Facebook, showing its vital role in marketing strategies worldwide.
When it comes to ads, some formats perform better than others:
- Vertical video ads with speech or voiceover see 3% higher conversions per dollar. This emphasizes the importance of engaging, mobile-first video content with clear audio.
- 74% of call-to-action buttons in Facebook ads encourage users to “Shop now.” This clearly demonstrates Facebook’s role in driving e-commerce sales.
- A significant 39% of users turn to Facebook when they are ready to buy, outranking TikTok (36%) and Instagram (29%). This makes Facebook a powerful platform for direct response marketing.
The Power of Video: Facebook Reels and Watch Time
Video content continues to dominate on Facebook, especially with the rise of Reels.
- Videos boast the second-highest engagement rate on Facebook pages.
- 616.8 million people watch Facebook Reels, representing about 31.1% of Facebook’s total ad inventory. This is a massive audience for short, engaging video content.
- The average watch time for a Facebook video is 10 seconds. If a video is watched for longer than 3 seconds, it counts as a view, but 10 seconds indicates active engagement.
Important Video Tip: A study found that 74% of Facebook videos are watched without sound. This means you must focus on compelling visuals and consider adding captions to grab viewers’ attention, as many will be scrolling with audio off.
Artificial Intelligence at Facebook: Shaping the Future
Facebook (Meta) is a leader in AI research and development, and this technology is deeply integrated into the platform. This massive user base provides an ideal environment for AI to learn and improve.
Here’s how AI is impacting Facebook in 2025:
- Personalized Feeds: Over 20% of the content in your Facebook feed is now recommended by AI from sources you don’t even follow. This means more diverse and relevant content discovery.
- Language Translation: Facebook’s AI model, No Language Left Behind (NLLB-200), can translate 200 different languages. This breaks down communication barriers globally. For some Indian languages, its translations were over 70% accurate.
- Speech Recognition: The MMS project has advanced speech recognition and text-to-speech technology for over 1,100 languages, making Facebook more accessible for low-resource languages.
- Powerful Infrastructure: Meta’s Research SuperCluster (RSC) AI Supercomputer features 16,000 GPUs, providing immense processing power for cutting-edge AI research.
- Open Source AI: Over the last decade, Meta has released more than 1,000 AI models, libraries, and datasets to the research community, fostering innovation across the field.
- Creative AI: Meta recently launched CM3leon, an advanced text-to-image AI generator, showcasing its capabilities in generative AI.
AI is making Facebook smarter, more personalized, and more inclusive, enhancing the user experience and opening new possibilities for businesses and creators.
Facebook (Meta) Revenue Statistics: A Financial Powerhouse
Facebook Revenue Over The Years
| Year | Revenue |
| Q2 2025 | $47.51 billion |
| Q1 2025 | $42.31 billion |
| Q4 2024 | $48.39 billion |
| Q3 2024 | $40.59 billion |
| Q2 2024 | $39.07 billion |
| Q1 2024 | $36.46 billion |
| 2023 | $134.9 billion |
| 2022 | $116.6 billion |
| 2021 | $117.92 billion |
| 2020 | $85.96 billion |
| 2019 | $70.69 billion |
| 2018 | $55.83 billion |
| 2017 | $40.65 billion |
| 2016 | $27.63 billion |
| 2015 | $17.92 billion |
Facebook (Meta) Average Revenue Per User (ARPU)
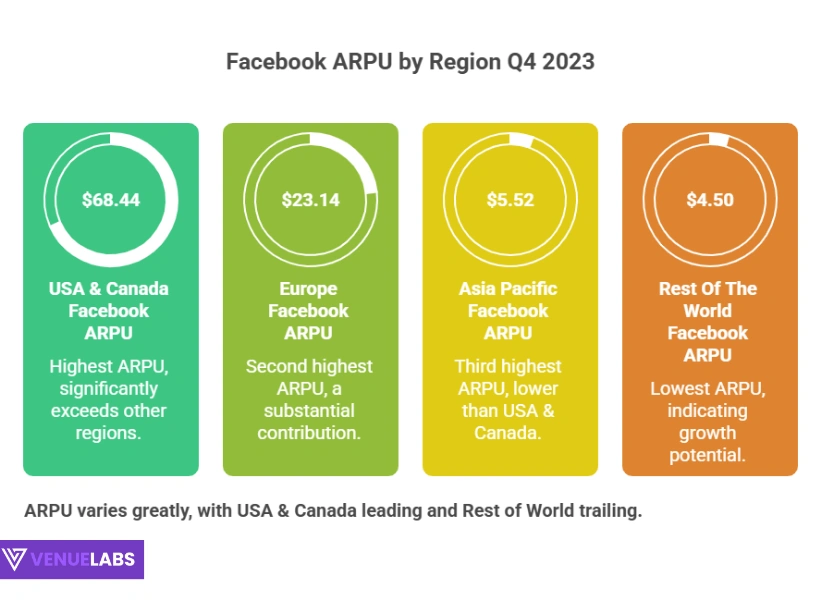
Facebook’s global ARPU was $13.12 as of Q4 2023. However, this varies significantly by region:
| World Region | Facebook ARPU |
| USA & Canada | $68.44 |
| Europe | $23.14 |
| Asia Pacific | $5.52 |
| Rest Of The World | $4.50 |
The much higher ARPU in North America and Europe highlights the economic power of users in these regions for advertisers.
Meta’s Workforce: Employees Behind the Platform
As of the latest data, Meta, Facebook’s parent company, has 67,317 employees. This marks a 22.16% decrease from 2022, when it had 86,482 employees, indicating a strategic reduction in staff.
Number Of Facebook (Meta) Employees Over The Years
| Year | Number Of Facebook (Meta) Employees |
| 2023 | 67,317 |
| 2022 | 86,482 |
| 2021 | 71,970 |
| 2020 | 58,604 |
Latest Insights from User Conversations (Quora, Reddit)
Beyond the official statistics, real users on platforms like Quora and Reddit often reveal emerging trends and concerns.
1. “Are Facebook Groups still relevant for engagement?”
Users are actively discussing the value of Facebook Groups. Many agree that while overall organic reach for pages might fluctuate, highly niche and active groups continue to offer excellent engagement. They act as strong communities where members feel a sense of belonging and are more likely to interact with relevant content. For businesses, this means focusing on building or participating in targeted groups rather than just posting broadly to a page.
2. “How can I improve my Facebook Reels views?”
This is a hot topic, reflecting the importance of short-form video. Users often share tips like:
* Hook in the first 3 seconds: Grab attention immediately.
* Use trending audio: Leverage popular sounds to increase discoverability.
* Add clear text overlays/captions: Many watch without sound.
* Post consistently: Regular content keeps your audience engaged.
* Engage with comments: Build a community around your Reels.
* Utilize relevant hashtags: Increase visibility.
3. “Is Facebook becoming an ‘older’ person’s platform?”
While Facebook’s largest user base is 25-34, and older demographics spend more time on the platform, younger users are still present. The discussion suggests that while Gen Z might flock to TikTok for trending content, they often maintain a Facebook profile for family connections, events, and specific interest groups. It’s less about exclusivity and more about different usage patterns across age groups. Businesses should adapt their content and strategy based on the specific age segment they want to reach on Facebook.
4. “What’s the deal with Facebook Marketplace?”
Many users highlight Facebook Marketplace as a surprisingly effective platform for buying and selling locally. They appreciate its ease of use and the ability to connect with sellers/buyers in their immediate area. This indicates a strong, practical utility for Facebook beyond just social networking, representing a direct e-commerce opportunity for individuals and small businesses.
These discussions show that while the core statistics remain strong, the nuances of how people use Facebook are always evolving. Staying attuned to these real-world conversations helps you refine your strategy.
FAQs About Facebook Statistics
1. How many active users does Facebook have in 2025?
Facebook has an impressive 3.07 billion monthly active users (MAUs) and 2.11 billion daily active users (DAUs) worldwide as of 2025, solidifying its position as one of the largest social media platforms globally.
2. What is the largest age group on Facebook in 2025?
The largest age group on Facebook in 2025 is 25 to 34 years old, accounting for 24.97% of its total user base, indicating strong engagement among young adults.
3. Which country has the most Facebook users?
India leads with the highest number of Facebook users, boasting 581.6 million people on the platform, followed by the United States with 279.8 million users.
4. How much time do users spend on Facebook daily?
On average, a Facebook user spends about 10 minutes and 12 seconds per session, with daily average times varying across age groups; for instance, users aged 55 to 64 spend the most time, averaging 45 minutes per day.
5. How important is video content on Facebook for businesses?
Video content, especially Facebook Reels, is highly important for businesses because videos have the highest engagement rate among post types (0.30%), and 616.8 million people actively watch Facebook Reels, offering a massive audience for dynamic, engaging content.
Also Read:
- Pinterest Statistics
- Microsoft Teams Statistics
- TikTok Statistics
- YouTube Statistics
- Video Marketing Statistics
Conclusion: Facebook’s Unstoppable Presence in 2026
In 2025, Facebook remains an undeniable force in the digital world. With 3.07 billion monthly active users and 2.11 billion daily active users, its scale and influence are unmatched.
From India’s massive audience to high penetration rates in countries like the Philippines, Facebook connects billions across the globe.
It’s a platform where users spend significant time, especially older demographics, and where video content, particularly Reels, drives high engagement.
For businesses, Facebook offers unparalleled opportunities for advertising, direct sales, and customer interaction, all enhanced by cutting-edge AI that personalizes feeds, translates languages, and fuels creative content.
As usage expands and features evolve, Facebook continues to redefine how the world communicates, shares, and interacts online, always setting the trend. Understanding these statistics is not just about numbers; it’s about unlocking the potential for your own growth and connection in this ever-expanding digital landscape.
Source: Statista, eMarketer

Comments
Be the first to leave a comment.