Smartphones are everywhere. They changed how we live, work, and play.
This guide gives you the latest facts for 2025. We will look at who uses smartphones, how much, and for what. You will also learn how to use this information to your benefit.
Smartphone Usage Statistics: What’s New?
People on sites like Quora and Reddit ask many questions about smartphone use. Here are some popular topics:
- Digital Wellbeing: Users actively seek ways to reduce screen time. They ask about app limits and notification management.
- AI Features: People are excited about new AI on phones. They discuss how it helps with photos, tasks, and privacy.
- Privacy Concerns: Users worry about their data. They ask about app permissions and location tracking.
- Mobile Payments: More people use their phones to pay. They ask about security and ease of use.
- Impact on Mental Health: There’s a lot of talk about how phones affect mood and sleep. Users share tips for healthier habits.
How Many People Use Smartphones?
Smartphones are almost universal.
- Worldwide: About 7.21 billion people use smartphones globally. This is 90% of the world’s population.
- Many people own more than one smartphone. This drives the high number.
- United States:82.2% of people in the U.S. own a smartphone.
- This is a big jump from just 20.2% in 2010.
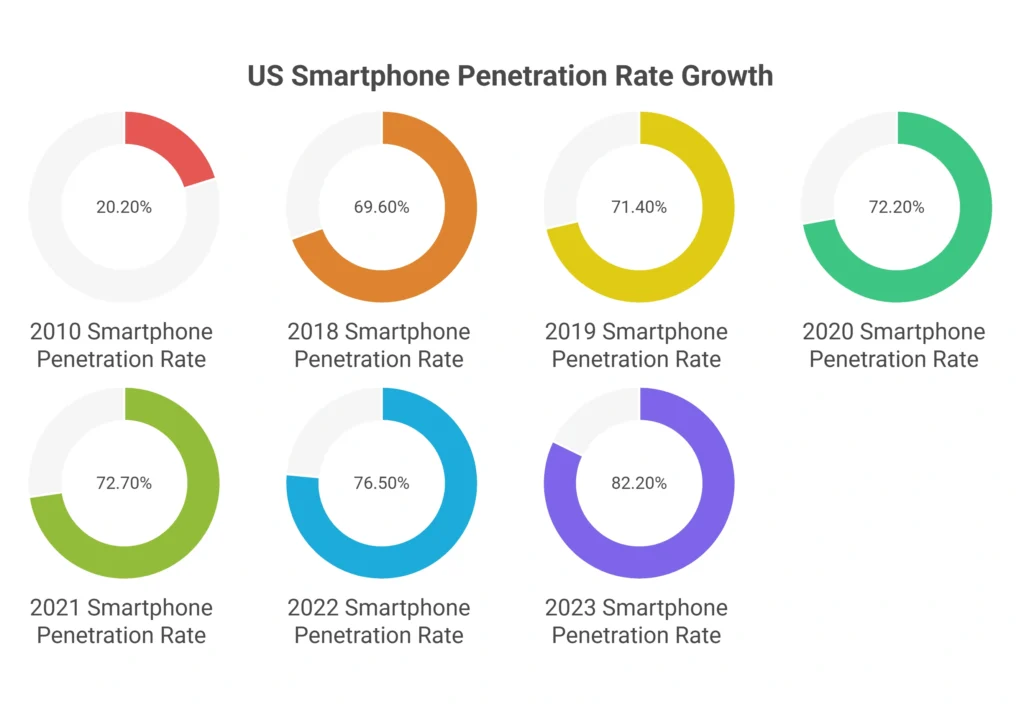
Here’s how smartphone ownership in the U.S. has grown:
| Year | Smartphone Penetration Rate In The United States |
| 2010 | 20.20% |
| 2018 | 69.60% |
| 2019 | 71.40% |
| 2020 | 72.20% |
| 2021 | 72.70% |
| 2022 | 76.50% |
| 2023 | 82.20% |
Also read about: iPhone Users Statistics
Global Smartphone Ownership
Smartphone adoption varies by country.
- Top Countries for Penetration:
- United States: 82.2%
- United Kingdom: 79.8%
- France: 78.8%
- Germany: 78.8%
- Italy: 77%
- These are mostly developed countries.
- Developing Economies: Adoption is lower.
- Brazil: 55.4%
- India: 35.4%
- Nigeria: 19.7%
Here are the top 20 countries by smartphone penetration:
| RANK | COUNTRY/MARKET | TOTAL POPULATION | SMARTPHONE PENETRATION | SMARTPHONE USERS |
| 1 | United Kingdom | 66.6M | 82.20% | 54.7M |
| 2 | Netherlands | 17.1M | 79.30% | 13.5M |
| 3 | Germany | 82.3M | 78.80% | 64.8M |
| 4 | Sweden | 10.0M | 78.80% | 7.9M |
| 5 | United States | 326.8M | 77.00% | 251.7M |
| 6 | Belgium | 11.5M | 76.60% | 8.8M |
| 7 | France | 65.2M | 76.00% | 49.6M |
| 8 | Spain | 46.4M | 72.50% | 33.6M |
| 9 | Canada | 37.0M | 72.10% | 26.6M |
| 10 | Australia | 24.8M | 68.60% | 17.0M |
| 11 | South Korea | 51.2M | 67.60% | 34.6M |
| 12 | Kazakhstan | 18.4M | 64.90% | 11.9M |
| 13 | Poland | 38.1M | 64.00% | 24.4M |
| 14 | Russian Federation | 144.0M | 63.80% | 91.9M |
| 15 | Taiwan | 23.7M | 60.00% | 14.2M |
| 16 | Italy | 59.3M | 58.00% | 34.4M |
| 17 | Malaysia | 32.0M | 57.50% | 18.4M |
| 18 | China | 1,415.0M | 55.30% | 782.8M |
| 19 | Japan | 127.2M | 55.30% | 70.3M |
| 20 | Romania | 19.6M | 53.80% | 10.5M |
Here are the top 20 countries by total smartphone users:
| RANK | COUNTRY/MARKET | TOTAL POPULATION | SMARTPHONE PENETRATION | SMARTPHONE USERS |
| 1 | China | 1,415.0M | 55.3% | 782.8M |
| 2 | India | 1,354.1M | 27.7% | 374.9M |
| 3 | United States | 326.8M | 77.0% | 251.7M |
| 4 | Russian Federation | 144.0M | 63.8% | 91.9M |
| 5 | Brazil | 210.9M | 41.3% | 87.2M |
| 6 | Indonesia | 266.8M | 27.4% | 73.2M |
| 7 | Japan | 127.2M | 55.3% | 70.3M |
| 8 | Germany | 82.3M | 78.8% | 64.8M |
| 9 | Mexico | 130.8M | 45.6% | 59.6M |
| 10 | United Kingdom | 66.6M | 82.2% | 54.7M |
| 11 | France | 65.2M | 76.0% | 49.6M |
| 12 | Philippines | 106.5M | 44.9% | 47.9M |
| 13 | Vietnam | 96.5M | 37.7% | 36.4M |
| 14 | South Korea | 51.2M | 67.6% | 34.6M |
| 15 | Italy | 59.3M | 58.0% | 34.4M |
| 16 | Spain | 46.4M | 72.5% | 33.6M |
| 17 | Turkey | 81.9M | 37.9% | 31.1M |
| 18 | Thailand | 69.2M | 43.7% | 30.2M |
| 19 | Iran | 82.0M | 35.1% | 28.7M |
| 20 | Egypt | 99.4M | 28.0% | 27.9M |
Also read about: Apple Music Users Statistics
Smartphone Users by Age
Age greatly impacts smartphone usage.
- Younger Adults (U.S.):
- 18 to 29 years: 97% use smartphones.
- 30 to 49 years: 97% use smartphones.
- Older Adults (U.S.):
- 50 to 64 years: 89% use smartphones.
- Over 65 years: 76% use smartphones.
Here is a full breakdown of U.S. smartphone ownership by age:
| Age Group | Own a SMARTPHONE (%) | Own a phone, but NOT a smartphone (%) | TOTAL of those who own ANY kind of phone (%) |
| 18-29 years old | 97 | 1 | 99 |
| 30-49 | 97 | 2 | 99 |
| 50-64 | 89 | 8 | 98 |
| 65+ | 76 | 17 | 94 |
How Much Time Do People Spend on Smartphones?
People spend many hours on their phones every day.
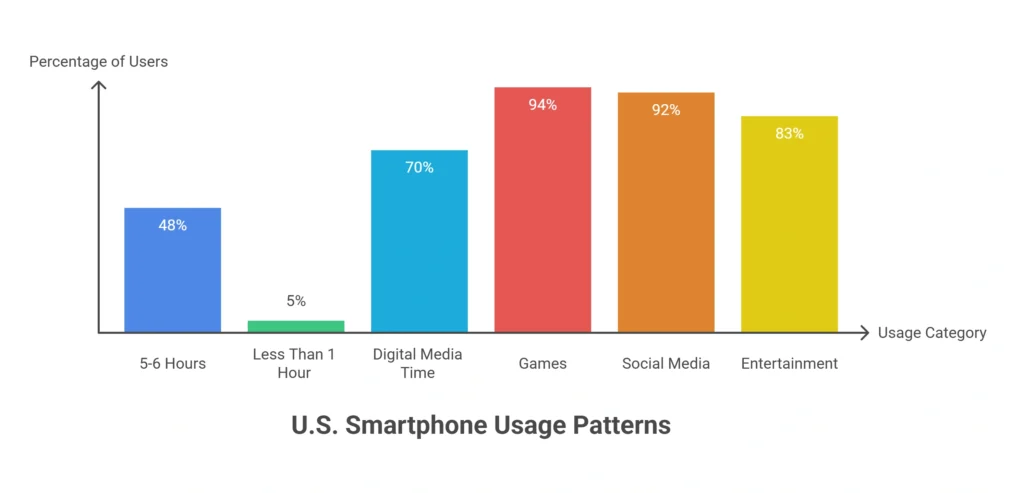
- U.S. Daily Usage:
- Almost half (48%) of people spend 5 to 6 hours daily on smartphones. That’s 132 million users!
- Only 5% use their phones for less than one hour daily.
- Smartphones take up 70% of digital media time in the U.S.
- Most of this time goes to games (94%), social media (92%), and entertainment (83%).
Here is a table on daily smartphone time in the U.S.:
| Daily Hours Spend On Smartphones | The Percentage of Smartphone Users | The Number Of Smartphone Users |
| Less than 1 hour | 5% | 13.76 million |
| 1 to 2 hours | 7% | 19.27 million |
| 3 to 4 hours | 22% | 60.56 million |
| 5 to 6 hours | 48% | 132.13 million |
| More than 6 hours | 18% | 49.55 million |
Global Average: The average daily time spent on smartphones is 3 hours and 43 minutes.
- Top Countries for Screen Time:
- Philippines: 5 hours 47 minutes
- Thailand: 5 hours 28 minutes
- Brazil: 5 hours 25 minutes
- Turkey is the only European country above the global average, at 4 hours 16 minutes.
What Do Users Do on Smartphones?
Smartphones help us do many things.
- Top Activities:
- Emails: 83%
- Taking Photos: 83%
- Surfing the Internet: 76%
- Maps/Directions: 73%
- Online Shopping: 71%
- Checking Social Media: 67%
- Listening to Music/Podcasts: 66%
Here is a more detailed list of smartphone activities:
| Smartphone Activity | Share Of Respondents |
| Emails | 83% |
| Taking Photos | 83% |
| Surfing the Internet | 76% |
| Maps/Directions | 73% |
| Online Shopping | 71% |
| Check/Post Social Media | 67% |
| Listening To Music/Podcasts | 66% |
| Watch Short Videos (Clips/Messages) | 65% |
| Online Banking | 60% |
| Video Calls | 59% |
| Taking Videos | 58% |
| Reading news | 58% |
| General purpose apps | 57% |
| Playing Games (Apps) | 52% |
| Watch long videos (Movies/TV) | 44% |
| Online Video Gaming | 35% |
Millennials’ Activities (U.S.):
- Watch Videos: 78% weekly
- Use Social Networks: 64%
- Listen to Music: 62%
- Play Games: 54%
- Research Products/Services to buy online: 44%
Latest Smartphone Usage Trends
Smartphone usage keeps changing.
- Continued Growth: Smartphone usage will grow by 2-3% year-over-year by 2025.
- This means nearly one billion new users.
- From 6.8 billion users in 2023, it will reach 7.34 billion by 2025.
- App Usage Time:
- Global app usage time increased by 30% since 2019.
- In the U.S., it rose by 25%.
- India leads with an 80% increase in app usage time.
- Long-term Growth: Smartphone users increased by 50% worldwide since 2016.
- In 2016, there were 3.67 billion users (45% of the population).
- By 2025, 85% of the total population will use smartphones.
- Web Access: By 2025, 72% of all internet users will only use smartphones to go online.
How Smartphones Drive E-commerce
Smartphones are now key for online shopping.
- Retail App Usage: 35% of mobile users use retail apps multiple times a week.
- 21% use them multiple times daily.
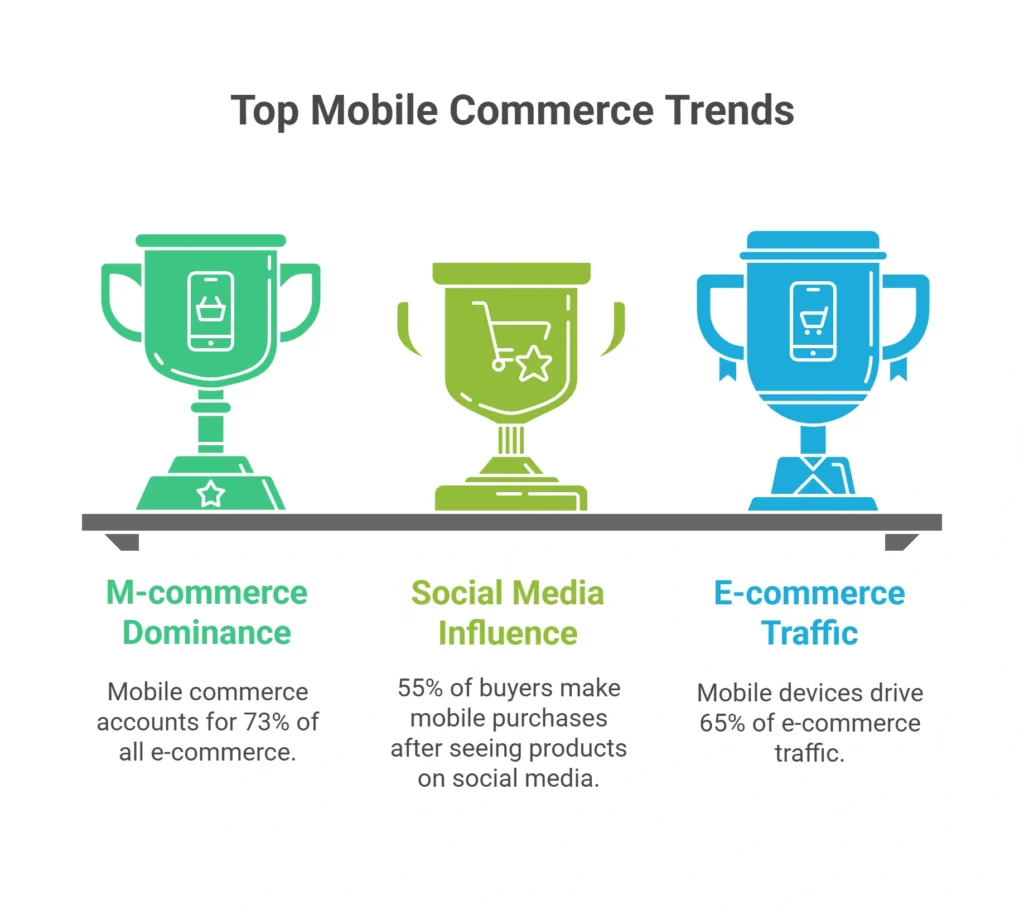
- M-commerce Dominance: Mobile commerce (m-commerce) accounts for 73% of all e-commerce.
- This percentage will likely grow.
- Social Media Influence: 55% of buyers make mobile purchases after seeing products on social media.
- Retailers with social media get 32% more sales.
- Holiday Sales:
- 40% of Cyber Monday sales come from mobile devices.
- 48% of online sales during Black Friday 2022 came from smartphones.
- E-commerce Traffic: Mobile devices drive 65% of e-commerce traffic.
- However, desktop still generates more sales (53% for mobile, 47% for desktop).
- Negative Experiences: 88% of mobile shoppers had a bad experience at least once.
- Issues include navigation (51%), small images (46%), and security (41%).
- 36% of customers abandon their carts because of these issues.
- Growth in U.S. Mobile Shoppers: The number of U.S. mobile shoppers will reach 187 million.
- This is an 11% increase from 167.8 million currently.
Smartphone Reliance and “Nomophobia”
Many people are highly reliant on their smartphones. This can lead to “nomophobia” – the fear of being without your phone.
- Daily Touches: U.S. smartphone users touch their phones 2,617 times daily on average.
- Frequent users can exceed 5,000 touches.
- Users unlock their phones at least 150 times a day.
- Frequent Checking: U.S. users check their phones at least 96 times daily.
- 66% check their phones as many as 160 times daily. This shows a high level of addiction.
- Internet Access: 27% of low-income Americans ($30,000/year or less) use their smartphones as their only internet access.
- 11% of those earning
- 30,000−
- 30,000−
- 99,999 rely on smartphones for internet.
- Youth and Smartphones:
- 72% of teenagers check their phones right after waking up.
- 56% of teenagers feel lonely or anxious without their phones.
- 54% of teenagers admit to spending too much time on their phones.
- 47% of parents say their kids are addicted.
- 76.19% of teachers say phones distract students in class.
- 20% of children have a smartphone by age 8.
- The average Gen Z member gets their first phone at 10.3 years old.
- 53% of U.S. children own a smartphone by age 11.
- Nomophobia Prevalence: 99.2% of smartphone users show some level of nomophobia.
- 37% have mild symptoms, 50% moderate, and 13% severe.
- 89% of college students report moderate to severe nomophobia.
- 66% of U.S. adults are affected. These are alarming numbers.
Mobile Traffic Statistics
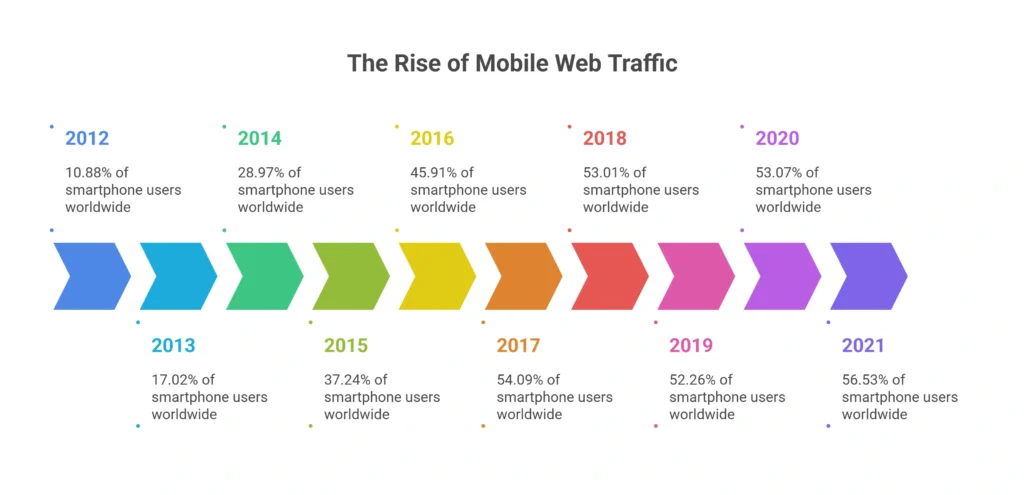
Mobile devices now drive most internet traffic.
- Global Web Traffic: More than 56.1% of global web traffic comes from smartphones.
- In 2012, this was only 10.88%. It reached 54.09% in 2017.
- The average for 2023 so far is 56.86%.
Here’s how mobile web traffic has grown:
| Year | Percentage of smartphone users worldwide |
| 2012 | 10.88% |
| 2013 | 17.02% |
| 2014 | 28.97% |
| 2015 | 37.24% |
| 2016 | 45.91% |
| 2017 | 54.09% |
| 2018 | 53.01% |
| 2019 | 52.26% |
| 2020 | 53.07% |
| 2021 | 56.53% |
| 2022 | 59.66% |
| 2023 | 56.86% |
Quarterly Mobile Traffic: In Q1 2023, 58.33% of global web traffic came from mobile devices.
- The highest ever was 59.54% in Q3 2022.
Here is a table showing mobile traffic worldwide by quarter:
| Quarter | Mobile Traffic |
| Q1 of 2019 | 48.71% |
| Q2 of 2019 | 49.91% |
| Q3 of 2019 | 51.51% |
| Q4 of 2019 | 52.60% |
| Q1 of 2020 | 51.92% |
| Q2 of 2020 | 51.53% |
| Q3 of 2020 | 50.81% |
| Q4 of 2020 | 52.20% |
| Q1 of 2021 | 54.80% |
| Q2 of 2021 | 55.09% |
| Q3 of 2021 | 55.78% |
| Q4 of 2021 | 54.40% |
| Q1 of 2022 | 55.79% |
| Q2 of 2022 | 58.99% |
| Q3 of 2022 | 59.54% |
| Q4 of 2022 | 59.16% |
| Q1 of 2023 | 58.33% |
U.S. Smartphone Market Share
In the U.S., a few brands dominate the smartphone market.
- Apple and Samsung Lead:
- Apple: 61.2% market share
- Samsung: 22.5% market share
- Together, they make up 83.7% of the U.S. market.
Here is the U.S. mobile manufacturer market share:
| Brands | Market Share |
| Apple | 61.2% |
| Samsung | 22.5% |
| Motorola | 3.6% |
| Xiaomi | 1.1% |
| Others | 9.3% |
How You Can Use These Statistics
This data offers valuable insights for many different groups.
For Businesses and Marketers:
- Mobile-First Strategy: Most internet traffic and e-commerce happen on mobile. Your website and marketing must be mobile-friendly.
- App Development: People spend a lot of time on apps. Consider developing an app if it fits your business.
- Targeting by Age: If your product targets young adults, focus on mobile campaigns. If it targets older adults, remember their lower (but still high) smartphone adoption.
- Social Media Marketing: Social media drives mobile purchases. Invest in strong social media presence.
- E-commerce Optimization: Optimize your mobile shopping experience. Fix navigation, image size, and checkout. This reduces abandoned carts.
- Local SEO: Many use smartphones for maps and directions. Optimize for local searches.
For App Developers and Designers:
- User Interface (UI) / User Experience (UX): Design for small screens and touch interactions. Make apps easy to use.
- Performance: Users expect fast apps. Optimize load times.
- Offline Access: Many users download content. Consider offline features.
- Digital Wellbeing Integration: Offer features that help users manage screen time.
- Privacy by Design: Build in strong privacy features. Be transparent about data use.
For Educators and Parents:
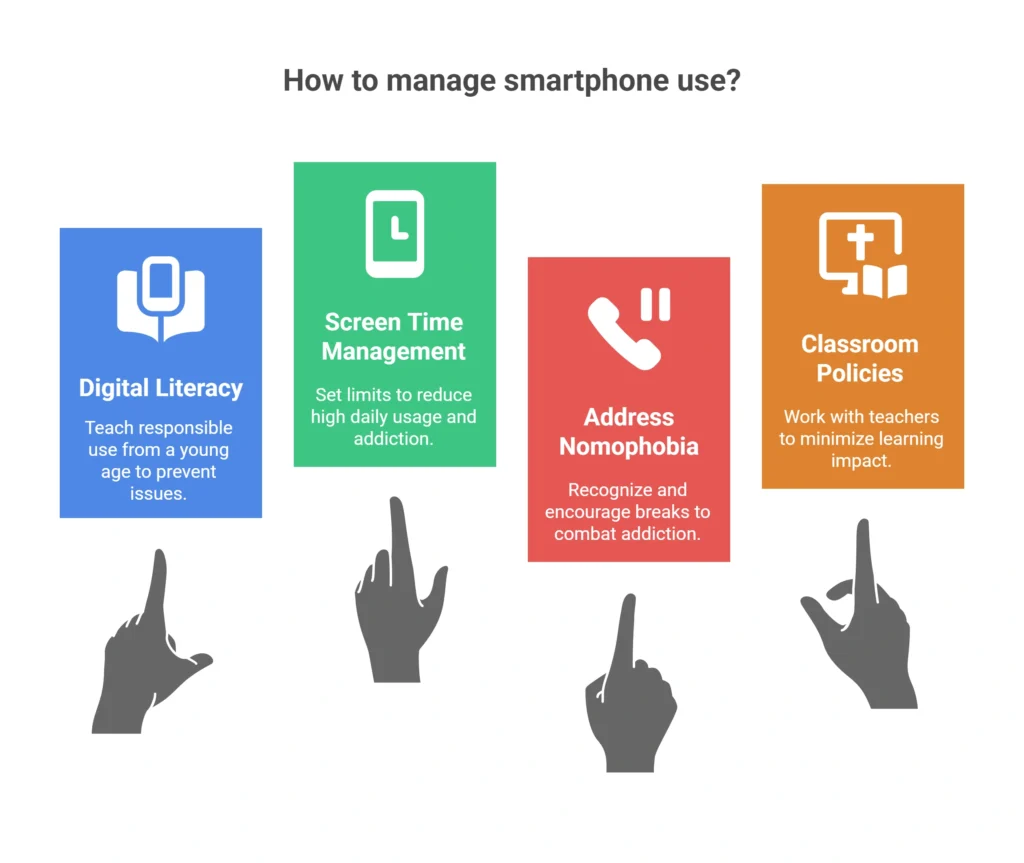
- Digital Literacy: Teach responsible smartphone use from a young age.
- Screen Time Management: Be aware of high daily usage. Set limits for children and teenagers.
- Address Nomophobia: Recognize signs of smartphone addiction. Encourage breaks from screens.
- Classroom Policies: Consider how smartphones impact learning. Work with teachers on policies.
For Individuals and Smartphone Users:
- Manage Screen Time: Be mindful of how much time you spend on your phone. Use built-in tools to track and limit usage.
- Digital Detox: Take breaks from your phone. This can improve mental health.
- Stay Secure: Protect your personal data. Be careful with app permissions and public Wi-Fi.
- Smart Shopping: Use your phone to compare prices and read reviews. But be aware of potential negative shopping experiences.
- Stay Informed: Use your phone for news and learning.
FAQs About Smartphone Usage Statistics
1. How big is mobile e-commerce in 2025?
M-commerce accounts for 73% of e-commerce sales and 65% of traffic.
2. Are smartphones addictive?
Yes, 99.2% of users show nomophobia symptoms, with 66% checking phones 160 times daily.
3. What is nomophobia?
Nomophobia is the fear of being without a phone, affecting 89% of college students severely.
4. How can I reduce smartphone usage?
Use apps like Forest, switch to grayscale mode, or set “no phone zones” at home.
5. What’s the future of smartphones?
By 2028, users will hit 8 billion, with 5G and foldable phones driving growth.
Also Read:
- Reddit Statistics
- Link Building Statistics
- Meta AI Users Statistics
- Marketing Automation Statistics
- Google Searches Statistic
Final Thoughts: The Smartphone’s Enduring Impact
Smartphones are more than just phones. They are central to our daily lives. In 2025, they continue to connect us, entertain us, and help us shop.
They also bring challenges, like addiction and privacy concerns. Understanding these trends helps us use smartphones more wisely.
For businesses, it means adapting to a mobile-first world. For individuals, it means making informed choices about our digital habits. The smartphone’s influence will only grow.
Source: Statista, StatCounter


Comments
Be the first to leave a comment.