
The Over-the-Top (OTT) industry is booming, transforming how people consume entertainment worldwide.
OTT platforms, which deliver video content directly over the internet, bypassing traditional cable or satellite TV, have become a staple in households.
From Netflix to regional platforms like Aha OTT, these services offer on-demand, high-quality content that caters to diverse viewer preferences.
In 2026, the OTT market continues its rapid growth, driven by increasing internet access, demand for flexible viewing, and exclusive content.
This article dives deep into the latest OTT statistics for 2026, covering viewership, revenue, market growth, user behavior, and more.
It also explores how individuals, content creators, and businesses can leverage OTT platforms for their benefit.
Additionally, we incorporate fresh insights from user discussions on platforms like Quora and Reddit to ensure the information reflects current trends and viewer interests.
With detailed tables, actionable tips, and answers to frequently asked questions, this guide is designed for anyone looking to understand or capitalize on the OTT industry.
Why OTT Platforms Are Thriving in 2026
OTT platforms have reshaped entertainment by offering convenience, variety, and affordability. Here are the key factors driving their success:
- Rising Internet Penetration: With global internet users surpassing 5.4 billion in 2024, more people can access high-speed internet, enabling seamless streaming.
- On-Demand Viewing: Viewers love the flexibility to watch content anytime, anywhere, on devices like smartphones, smart TVs, and tablets.
- Exclusive Content: Platforms like Netflix, Disney+, and Amazon Prime produce high-quality original series and movies, attracting millions of subscribers.
- Affordable Subscriptions: Many platforms offer low-cost or ad-supported plans, making OTT accessible to a wide audience.
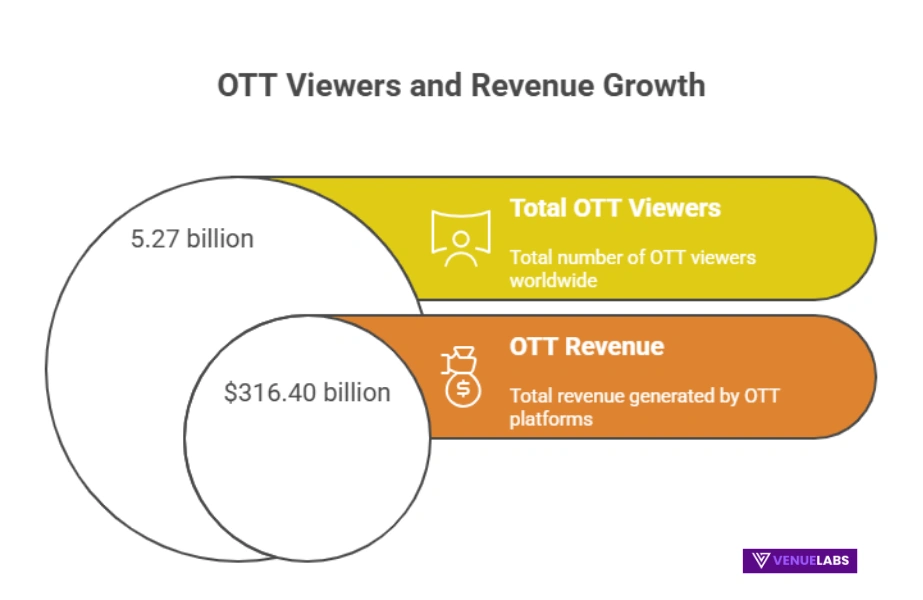
The OTT market is expected to reach 5.27 billion users and generate $316.40 billion in revenue. These numbers highlight the massive potential for businesses, content creators, and marketers to tap into this growing industry.
Also read about: Netflix Subscribers Statistics
Key OTT Statistics
Let’s explore the most compelling OTT statistics, covering viewership, revenue, market growth, and user behavior. These insights will help you understand the industry’s trajectory and how to leverage it.
Global OTT Viewership
The number of OTT users has skyrocketed, driven by increased accessibility and the appeal of on-demand content. The COVID-19 pandemic significantly boosted viewership, with an estimated 800 million new users joining during lockdowns.
- Global OTT Users: The number of OTT users reached 4.33 billion in 2026, up from 3.92 billion in 2024 and 3.74 billion in 2023.
- Growth Forecast: By 2029, OTT users are projected to hit 4.91 billion, reflecting a 25.46% growth rate from 2024 to 2029.
- Regional Insights: North America and Asia-Pacific lead in user growth, with countries like Canada boasting an 89.12% penetration rate.
| Year | Number of OTT Users |
| 2029* | 4.91 billion |
| 2028* | 4.72 billion |
| 2027* | 4.52 billion |
| 2026* | 4.33 billion |
| 2025 | 4.12 billion |
| 2024 | 3.92 billion |
| 2023 | 3.74 billion |
| 2022 | 3.53 billion |
| 2021 | 3.67 billion |
| 2020 | 3.46 billion |
*Projected figures.
OTT Revenue Trends

The OTT industry is a financial powerhouse, with revenue soaring due to subscription models, ad-supported platforms, and exclusive content.
- Global OTT Revenue: In 2025, the OTT market generated $316.40 billion, up from $295.40 billion in 2023.
- Average Revenue Per User (ARPU): The ARPU for OTT platforms is projected to reach $82.7 in 2025, compared to $80.7 in 2024 and $77 in 2023.
- Video Advertising Revenue: The OTT video advertising market is set to reach $176.60 billion in 2025, with forecasts predicting $318 billion by 2027.
| Year | OTT Revenue ($bn) | ARPU ($) |
| 2025 | 316.40 | 82.7 |
| 2024 | 295.40 | 80.7 |
| 2023 | 272.70 | 77.0 |
| 2022 | 236.80 | 72.37 |
| 2021 | 180.00 | 64.53 |
| 2020 | 131.10 | 52.12 |
| 2019 | 98.67 | 42.46 |
*Projected figures.
OTT Market Growth
The OTT market is poised for explosive growth, driven by consumer demand for flexible, high-quality content.
- Market Size: The global OTT market is expected to reach $0.45 trillion in 2025, with a CAGR of 28.19% from 2023 to 2028.
- Future Projections: By 2028, the market is forecasted to hit $1.55 trillion, and by 2032, the OTT content market could reach $1.94 trillion.
- Key Players: Netflix, Amazon Prime, Hulu, and Disney+ dominate, but regional platforms like Aha OTT and Disney+Hotstar are gaining traction.
Time Spent on OTT Platforms
Viewers are dedicating significant time to OTT platforms, reflecting their deep integration into daily life.
- Global Average: Users spend an average of 17 hours per week streaming OTT content, down from a peak of 19 hours in 2022.
- U.S. Viewership: Americans spend 3 hours and 9 minutes daily (or 21 hours weekly) on OTT platforms.
- Live Streaming: Live streaming accounts for 23% of global viewing time, with platforms like Twitch leading the market.
| Year | Average Weekly Hours (Global) | Average Daily Hours (U.S.) |
| 2023 | 17 hours | 70 minutes |
| 2022 | 19 hours | 70 minutes |
| 2021 | 18 hours | 67 minutes |
| 2020 | 16 hours | 62 minutes |
| 2019 | 14 hours | 51 minutes |
OTT Penetration Rates
The adoption of OTT platforms is widespread, with penetration rates reflecting their global reach.
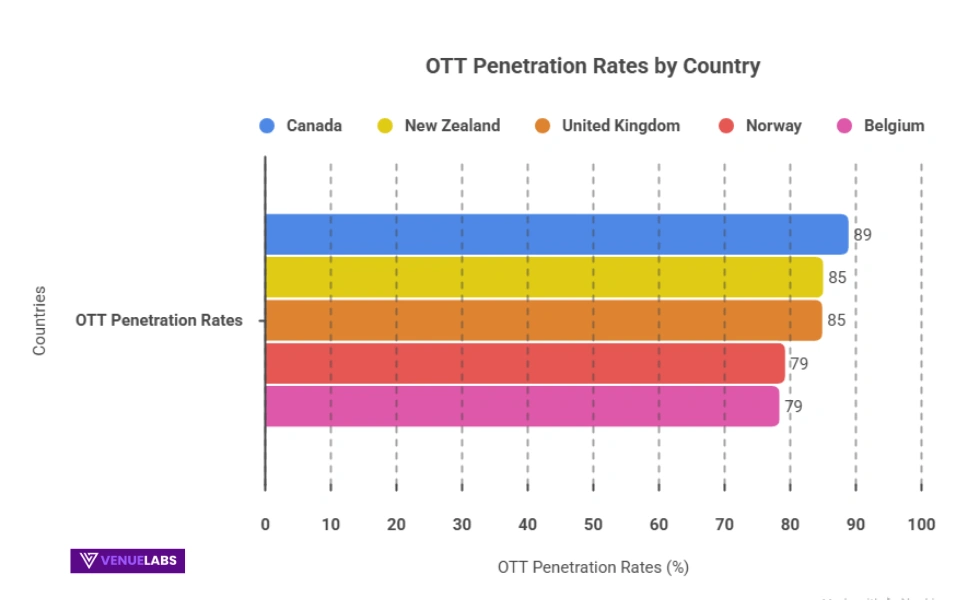
- Global Penetration: The OTT penetration rate is projected to reach 47.83% in 2025, up from 45.72% in 2023.
- Country Leaders: Canada leads with an 89.12% penetration rate, followed by New Zealand (85.27%) and the United Kingdom (85.13%).
| Country | Penetration Rate |
| Canada | 89.12% |
| New Zealand | 85.27% |
| United Kingdom | 85.13% |
| Norway | 79.46% |
| Belgium | 78.60% |
Also read about: Screen Time Statistics
Platform-Specific OTT Statistics
Major platforms like Netflix, Amazon Prime, Hulu, and Disney+ dominate the OTT landscape, but regional players are making waves. Here’s a breakdown of key platforms.
Netflix
Netflix remains the global leader in OTT, known for its vast content library and ad-supported plans.
- Subscribers: Netflix boasts 277.65 million subscribers worldwide as of Q2 2024, with 15 million on its ad-supported plan launched in 2022.
- Revenue: In 2023, Netflix generated $33.72 billion, with $18.93 billion recorded in Q1 and Q2 of 2024.
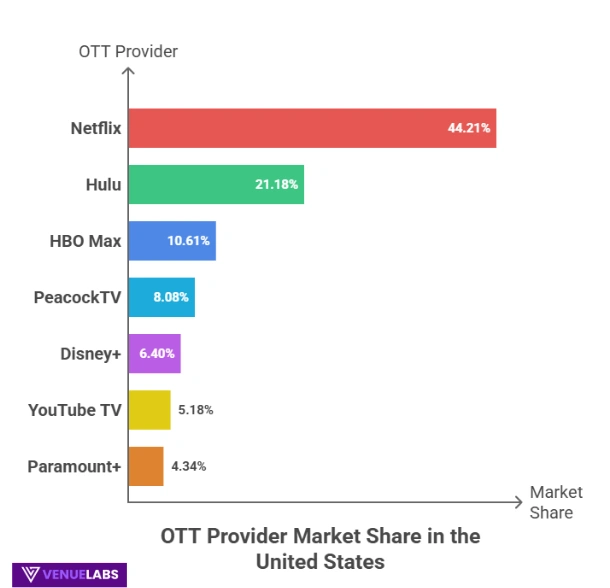
- Market Share: Netflix holds 44.21% of the U.S. OTT market, followed by Hulu (21.18%) and HBO Max (10.61%).
| Year | Netflix Subscribers (Millions) | Revenue ($bn) |
| 2024 (Q2) | 277.65 | 18.93 (Q1+Q2) |
| 2023 | 260.28 | 33.72 |
| 2022 | 230.70 | 31.61 |
| 2021 | 219.70 | 29.70 |
| 2020 | 192.90 | 24.99 |
Amazon Prime Video
Amazon Prime Video is a strong contender, leveraging its integration with Amazon’s ecosystem.
- Subscribers: Amazon Prime has over 200 million members globally, with 157 million in the U.S. as of Q3 2023.
- Revenue: In 2024, Amazon Prime Video generated $35.22 billion, contributing 6.85% to Amazon’s total revenue.
| Year | Amazon Prime Members (Millions) | Revenue ($bn) |
| 2022 | 200 | 35.22 |
| 2021 | 150 | 31.77 |
| 2020 | 125 | 25.21 |
| 2019 | 100 | 19.21 |
Hulu
Hulu is a key player in the U.S., known for its mix of on-demand and live TV options.
- Subscribers: Hulu reached 48.2 million subscribers in 2023, up from 45 million in 2022.
- Revenue: Hulu generated $11.2 billion in 2023, a 4.6% increase from $10.7 billion in 2022.
| Year | Hulu Subscribers (Millions) | Revenue ($bn) |
| 2023 | 48.2 | 11.2 |
| 2022 | 45.0 | 10.7 |
| 2021 | 41.0 | 9.6 |
| 2020 | 32.0 | 7.2 |
Disney+
Disney+ has grown rapidly, driven by its family-friendly content and Star Wars and Marvel franchises.
- Subscribers: Disney+ has 150.2 million subscribers in 2023, down from 164.2 million in 2022.
- Revenue: Disney+ generated $8.4 billion in 2023, up 13% from $7.4 billion in 2022.
| Year | Disney+ Subscribers (Millions) | Revenue ($bn) |
| 2023 | 150.2 | 8.4 |
| 2022 | 164.2 | 7.4 |
| 2021 | 118.1 | 5.2 |
| 2020 | 73.7 | 2.8 |
Regional Platforms: Disney+Hotstar and Aha OTT
Regional platforms are gaining popularity, especially in markets like India.
- Disney+Hotstar: Recorded 59 million peak concurrent viewers during the 2023 Men’s Cricket World Cup final, setting a streaming record.
- Aha OTT: This South Indian platform is rapidly growing, focusing on Telugu and Tamil content, appealing to regional audiences.
OTT Advertising Trends
Advertising on OTT platforms is a goldmine for marketers, with high engagement and completion rates.
- Ad Completion Rates: OTT ads have a 90%+ completion rate due to non-skippable formats.
- Viewer Recall: 72% of OTT viewers remember specific ads, and 66% discover new products or services through OTT ads.
- Ad Preferences: 57% of U.S. adults prefer low-cost or free ad-supported OTT platforms, with 25% willing to watch 10-minute ads for free content.
| Metric | Statistic |
| OTT Ad Completion Rate | 90%+ |
| Viewers Remembering Specific Ads | 72% |
| Viewers Discovering New Products | 66% |
| Preference for Ad-Supported Platforms | 57% (U.S. adults) |
OTT User Behavior
Understanding how users interact with OTT platforms is crucial for content creators and businesses.
- Binge-Watching: Over 70% of OTT users binge-watch content, with Netflix users (88%) and Hulu users (70%) leading the trend.
- Daily Usage: 34.97% of users access OTT content multiple times a day, and 74.89% use it at least three times a week.
- Subscription Trends: 86% of users plan to maintain or expand their subscriptions, while 14% consider reducing them.
| Behavior | Statistic |
| Binge-Watching Users | 70%+ |
| Daily OTT Usage | 34.97% |
| Weekly OTT Usage (3+ times) | 74.89% |
| Plan to Maintain Subscriptions | 61% |
| Plan to Add Subscriptions | 25% |
Emerging Trends from Quora and Reddit
Recent discussions on Quora and Reddit reveal user interests and concerns shaping the OTT landscape in 2025:
- Demand for Regional Content: Users on Reddit, particularly in India, praise platforms like Aha OTT for offering regional language content (e.g., Telugu and Tamil), which resonates with local audiences.
- Ad Fatigue: Quora users express frustration with increasing ad frequency on platforms like Netflix’s ad-supported tier, pushing some to explore ad-free alternatives or regional platforms.
- Live Sports Streaming: Reddit threads highlight growing interest in live sports on OTT platforms, with Disney+Hotstar’s cricket streaming success as a prime example.
- Cost-Conscious Choices: Users on both platforms discuss “subscription fatigue,” with many opting for bundled services or free ad-supported platforms to manage costs.
These insights suggest that businesses should focus on localized content, balanced ad experiences, and competitive pricing to attract and retain viewers.
How to Leverage OTT Platforms for Your Benefit
Whether you’re a content creator, business owner, or marketer, the OTT industry offers immense opportunities. Here’s how you can capitalize on it:
For Content Creators
- Produce Niche Content: Create content for underserved markets, such as regional languages or specific genres like documentaries or eLearning.
- Leverage Live Streaming: With 41% of internet users engaging with live streams, offer live Q&As, tutorials, or events to build a loyal audience.
- Partner with Platforms: Collaborate with platforms like Aha OTT or Disney+Hotstar to distribute region-specific content.
For Businesses
- Launch Your OTT Platform: Use services like VPlayed to create a customizable OTT platform in days, offering full branding and revenue control.
- Advertise on OTT: With 90%+ ad completion rates, invest in targeted, non-skippable ads to reach engaged audiences.
- Bundle Services: Offer bundled subscriptions with other services to attract cost-conscious users.
For Marketers
- Target Young Audiences: Focus on the 18-34 age group, which constitutes 54% of U.S. Connected TV viewers.
- Use Programmatic Advertising: Capitalize on the 207% surge in programmatic impressions on connected TVs for cost-effective campaigns.
- Create Engaging Ads: Since 66% of viewers discover new products via OTT ads, craft compelling, story-driven advertisements.
FAQs About OTT Statistics
1. What is driving the growth of OTT platforms ?
The growth of OTT platforms is driven by increasing internet penetration, demand for on-demand content, and the availability of high-quality exclusive content. Affordable subscriptions and ad-supported plans also make OTT accessible to a wide audience.
2. How can businesses benefit from OTT platforms?
Businesses can launch their own OTT platforms to distribute content, advertise on platforms with high ad completion rates (over 90%), or bundle services to attract subscribers. OTT offers a direct channel to engage with targeted audiences.
3. Why is binge-watching so popular on OTT platforms?
Binge-watching is popular because OTT platforms offer entire seasons of shows, allowing viewers to watch multiple episodes without waiting. Over 70% of users, especially on Netflix (88%) and Hulu (70%), enjoy this uninterrupted viewing experience.
4. What are the challenges of OTT advertising for viewers?
Some viewers experience ad fatigue due to frequent or lengthy ads, particularly on ad-supported tiers. Platforms must balance ad frequency with user experience to retain subscribers, as discussed on Quora.
5. How can content creators use OTT to reach new audiences?
Content creators can produce niche or regional content, leverage live streaming for real-time engagement, or partner with platforms like Aha OTT to reach specific demographics, capitalizing on the growing demand for localized content.
Also Read:
- Latest Digital Marketing Statistics
- Video Marketing Statistics
- Email Marketing Statistics
- WhatsApp Statistics
- iPhone Users Statistics
Conclusion
The OTT industry in 2026 is a dynamic and rapidly growing market, with 5.27 billion users and $316.40 billion in revenue.
Platforms like Netflix, Amazon Prime, Hulu, and Disney+ dominate, while regional players like Aha OTT and Disney+Hotstar are carving out significant niches.
With 70% of users binge-watching and 57% of U.S. adults preferring ad-supported platforms, the opportunities for content creators, businesses, and marketers are vast.
By understanding user behavior, leveraging advertising, and tapping into emerging trends like live streaming and regional content, you can position yourself for success in this thriving industry.


Comments
Be the first to leave a comment.