
Since its launch in November 2019, Disney Plus has rapidly transformed the streaming landscape, becoming a formidable competitor to established players.
As we navigate 2025, the platform continues to evolve, adapting to market shifts, content demands, and subscriber expectations.
This comprehensive article delves into the latest Disney Plus statistics 2025, offering an in-depth look at its subscriber base, financial performance, market position, and content strategy.
Whether you’re a potential subscriber, an investor, or simply curious about the streaming world, understanding these figures empowers you to grasp the current state and future trajectory of Disney’s streaming powerhouse.
Disney Plus’s Global Footprint: Subscribers and Growth
Disney Plus has cemented its position as a global streaming giant, reaching millions of households across the world. Despite a highly competitive market, the platform continues to demonstrate its significant appeal.
How Many Disney Plus Subscribers Are There?
As of Q1 2025, Disney Plus boasts an impressive 124.6 million subscribers worldwide. This figure reflects a dynamic landscape where the platform has experienced both gains and slight losses in different segments.
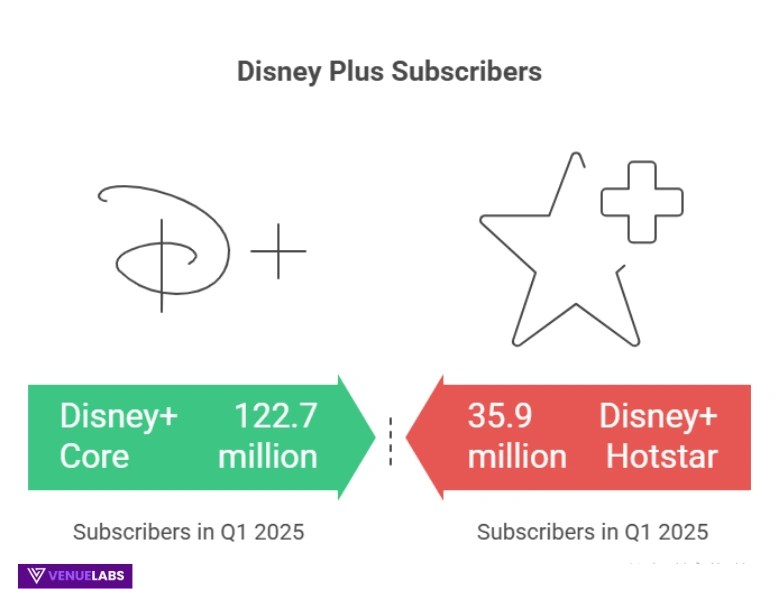
While Disney+ Hotstar saw some subscriber declines in recent quarters, the core Disney+ service has managed to attract new users in other regions.
Let’s break down the subscriber numbers:
- Total Subscribers (Q1 2025): 124.6 million
- Disney+ Core Subscribers: 122.7 million (a 4% rise from 118.3 million in Q3 2024)
- Disney+ Hotstar Subscribers: 35.9 million (a 1% increase from 35.5 million in Q3 2024)
This indicates that while the Hotstar segment faces unique regional challenges, the core Disney+ offering is experiencing steady growth.
Quarterly Subscriber Trends
The journey to 124.6 million subscribers has seen its ups and downs. Here is a quarterly breakdown of Disney+ subscribers, illustrating its growth trajectory since early 2021:
| Time | Disney Plus Subscribers (Millions) |
| Q1 2021 | 94.9 |
| Q2 2021 | 103.6 |
| Q3 2021 | 116 |
| Q4 2021 | 118.1 |
| Q1 2022 | 129.8 |
| Q2 2022 | 137.7 |
| Q3 2022 | 152.1 |
| Q4 2022 | 164.2 |
| Q1 2023 | 161.8 |
| Q2 2023 | 157.8 |
| Q3 2023 | 146.1 |
| Q4 2023 | 150.2 |
| Q1 2024 | 149.6 |
| Q2 2024 | 153.6 |
| Q3 2024 | 153.8 |
| Q4 2024 | 158.6 |
(Note: Disney has announced it will stop reporting quarterly paid-subscriber and ARPU figures for Disney+, Hulu, and ESPN+ starting after Q3 Fiscal 2025, shifting the focus to profitability metrics.)
Annual Subscriber Growth
Looking at the annual figures provides a broader perspective on Disney Plus’s impressive subscriber acquisition:
| Year | Subscribers (Millions) |
| 2024 | 158.6 |
| 2023 | 150 |
| 2022 | 164.2 |
| 2021 | 118.1 |
| 2020 | 73.3 |
The platform’s rapid ascent is remarkable, especially when compared to Netflix, which took approximately a decade to amass a similar number of customers in a less crowded market.
Also read about: Netflix Subscribers Statistics
Disney Plus Demographics: Who is Watching?
Understanding the user base is crucial for content strategy and marketing. Disney Plus appeals to a broad audience, but some demographic segments show stronger engagement.
Gender Distribution
In the U.S., Disney Plus sees a nearly even split between genders, indicating its content resonates across different viewer preferences.
| Gender | Share Of Users |
| Males | 55% |
| Females | 45% |
This balanced distribution is likely due to the platform’s varied content, which includes action-packed Marvel and Star Wars franchises alongside family-friendly animated movies.
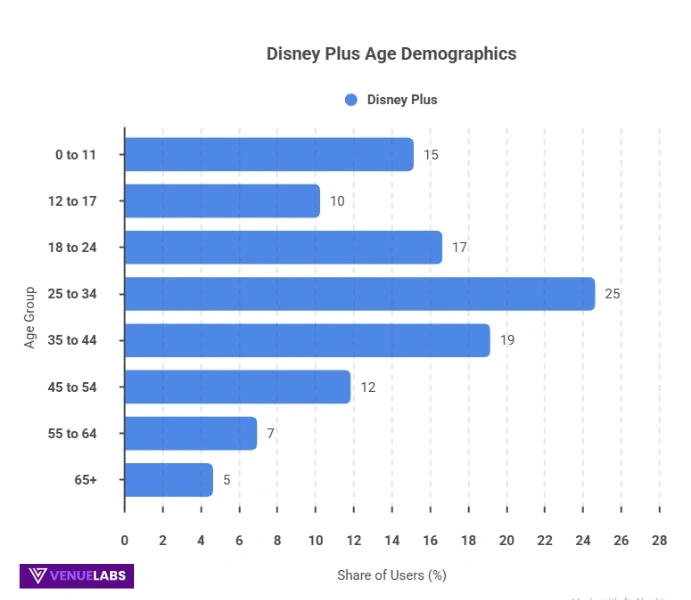
Age Demographics
Disney Plus has a strong appeal to younger audiences and families, reflecting its brand heritage.
| Age | Share Of Users |
| 0 to 11 years | 15.2% |
| 12 to 17 years | 10.3% |
| 18 to 24 years | 16.7% |
| 25 to 34 years | 24.7% |
| 35 to 44 years | 19.2% |
| 45 to 54 years | 11.9% |
| 55 to 64 years | 7.0% |
| 65 and over | 4.7% |
The largest group of users, 43.9%, falls within the 25 to 44 age bracket, highlighting the platform’s success in attracting young adults and families. A significant 42.2% of users are under 24, underscoring its appeal to children and teens.
Also read about: OTT Statistics 2026
Disney Plus Financial Performance: Revenue and ARPU
Disney Plus’s financial health is a critical indicator of its long-term viability and success in the competitive streaming wars. The platform has shown remarkable revenue growth and is making strides toward profitability.
Robust Revenue Growth
In the fiscal year 2024, Disney Plus generated an impressive $10.4 billion in total revenue. This figure positions the platform to potentially exceed its 2023 performance of $8.4 billion.
Here’s a look at Disney Plus’s yearly revenue:
| Year | Revenue (Billions) |
| 2024 | $10.4 |
| 2023 | $8.4 |
| 2022 | $7.4 |
| 2021 | $5.3 |
| 2020 | $2.8 |
The platform’s direct-to-consumer (DTC) segment achieved profitability in 2024, reporting earnings of $143 million. This marks a significant turnaround after years of operating losses, proving Disney’s strategic shift towards financial sustainability is working.
Average Revenue Per User (ARPU)
| Year | Core Disney+ ARPU | Disney+ Hotstar ARPU |
| Q2 2023 | $6.47 | $6.58 |
| Q3 2023 | $6.58 | $0.59 |
| Q4 2023 | $6.7 | $0.7 |
| Q1 2024 | $6.84 | $1.28 |
| Q2 2024 | $7.28 | $0.7 |
| Q3 2024 | $7.22 | $1.05 |
| Q4 2024 | $7.30 | $0.78 |
Disney has been strategically adjusting pricing, with another round of increases for Disney+, Hulu, and ESPN+ implemented in October 2024 in the U.S. This aims to further improve ARPU and overall profitability.
Also read about: Screen Time Statistics
Market Share and Competition
In the fiercely competitive Subscription Video-On-Demand (SVOD) market, Disney Plus maintains a strong position, but it also faces intense rivalry.
SVOD Market Share in the U.S.
Disney Plus holds a 12% share of the U.S. SVOD market, making it the fourth most popular streaming platform in the country. However, this figure has seen slight fluctuations.
It maintained a 12% share throughout 2022 but experienced a marginal decrease to 11% in 2023 and 10% in Q1 2024, primarily due to heightened competition.
| SVOD Platform | Market Share |
| Amazon Prime Video | 22% |
| Netflix | 21% |
| Max | 13% |
| Disney+ | 12% |
| Hulu | 10% |
| Paramount+ | 9% |
| Apple TV+ | 8% |
| Peacock | 1% |
| Other | 4% |
Despite these slight shifts, Disney+ remains a major player, battling for eyeballs with giants like Netflix and Amazon Prime Video.
Subscriber Retention
Customer retention is vital for sustained growth. On average, 68% of Disney Plus subscribers continue their subscription after six months.
For those who only subscribe to Disney+ (without the Hulu or ESPN+ bundle), the retention rate is 62%. For comparison, Netflix boasts a slightly higher retention rate of 72%, while Hulu sees 65% of its subscribers staying on after six months.
Content and Engagement: The Heart of Disney Plus
The vast and beloved content library is arguably Disney Plus’s greatest asset, attracting and retaining subscribers worldwide.
Extensive Content Library
Disney Plus offers an enormous collection of content:
- 13,000+ shows and movies
- Over 8,000 hours of content
- Available in 150 countries and 39 languages
This extensive library draws from iconic brands like Marvel, Pixar, Star Wars, and the classic Disney vault, ensuring a wide appeal across all age groups.
Original series like “Moon Knight” and “Obi-Wan Kenobi” have also been crucial in attracting and engaging audiences.
App Downloads and Usage
Mobile app downloads provide insight into new user acquisition and platform engagement. In Q3 2024, Disney+ saw 4.49 million downloads in the United States.
However, this marked the lowest quarterly download figure since its launch, indicating a noticeable decline compared to earlier periods (5.91 million in Q1 2023).
Here’s a quarterly view of Disney Plus app downloads in the U.S.:
| Time | Downloads (Millions) |
| Quarter 1 2022 | 9.66 |
| Quarter 2 2022 | 8.51 |
| Quarter 3 2022 | 8.33 |
| Quarter 4 2022 | 8.50 |
| Quarter 1 2023 | 5.91 |
| Quarter 2 2023 | 5.07 |
| Quarter 3 2023 | 4.79 |
| Quarter 4 2023 | 4.82 |
| Quarter 1 2024 | 4.26 |
| Quarter 2 2024 | 3.86 |
| Quarter 3 2024 | 4.49 |
Despite the fluctuating download numbers, Disney+ remains the highest-grossing mobile app for The Walt Disney Company, generating over $1.22 billion in in-app revenue globally.
Top Disney Apps by Revenue
| Characteristic | Revenue in U.S. dollars (Millions) |
| Disney+ | 1,226.94 |
| ESPN: Live Sports & Scores | 223.85 |
| Hulu: Stream TV shows & movies | 48.26 |
| Disney+ Hotstar | 16.02 |
| Star+ | 14.12 |
This highlights the significant monetization success of the flagship Disney+ app.
Emerging Trends and User Concerns: What’s Being Discussed?
Beyond the hard numbers, understanding real-world user sentiment and emerging trends, often seen on platforms like Quora and Reddit, provides crucial qualitative insights.
The Ad-Supported Tier: A Growing Trend
A significant shift in streaming strategy is the rise of ad-supported tiers. The number of Disney+ viewers opting for ad-supported plans has been steadily increasing, signifying a growing appreciation for more budget-friendly subscription options.
- 2022: 109.8 million ad-supported viewers
- 2023: 122 million ad-supported viewers
- 2024 (Projected): 134 million ad-supported viewers
- 2025 (Projected): 145.2 million ad-supported viewers
- 2026 (Projected): 152.8 million ad-supported viewers
This growth indicates a successful monetization avenue for Disney+, attracting new audiences and becoming a vital revenue generation model.
Content Spending Strategy
Disney’s spending on content peaked at $29.9 billion in 2022 but has seen a decline since, with estimates of $27.2 billion in 2023 and about $25 billion in 2024.
This shift reflects a strategic focus on cost-cutting measures to improve profitability, rather than just sheer volume of new productions.
While some users on Reddit express concerns about content quantity, the company aims to maintain quality while optimizing expenditure.
Subscriber Backlash and Controversy
In late 2025, Disney faced significant backlash and calls for cancellations over the temporary suspension of ABC’s “Jimmy Kimmel Live!”.
This controversy, linked to Kimmel’s comments and subsequent corporate decisions, led to trending hashtags like #BoycottDisney.
Reports indicated a drop in market value and an instantaneous financial fallout for The Walt Disney Co.
This incident highlights the direct impact of corporate decisions and content moderation on subscriber sentiment and loyalty, a frequently discussed topic among users on social media.
The subsequent announcement of price increases was also interpreted by some as an attempt to recover from brand damage.
FAQs About Disney Plus Statistics
1. How many subscribers does Disney Plus currently have globally in 2025?
As of Q1 2025, Disney Plus has 124.6 million subscribers worldwide, with 122.7 million being Disney+ Core subscribers and 35.9 million subscribing to Disney+ Hotstar.
2. What is Disney Plus's total revenue for the fiscal year 2024?
In the fiscal year 2024, Disney Plus generated an impressive $10.4 billion in total revenue, continuing its strong financial performance.
3. Which age group represents the largest share of Disney Plus subscribers?
The largest group of Disney Plus users, comprising 24.7%, falls into the 25 to 34-year-old age bracket, followed closely by the 35 to 44-year-old age group.
4. What is Disney Plus's market share in the U.S. SVOD market?
Disney Plus holds a 12% share of the U.S. subscription video-on-demand (SVOD) market, making it the fourth most popular streaming platform in the country.
5. Has Disney Plus introduced ad-supported subscription tiers, and are they popular?
Yes, Disney Plus has introduced ad-supported tiers, and they are gaining popularity, with projections indicating the audience for these plans will reach 145.2 million by 2025, showing a growing preference for more budget-friendly streaming options.
Also Read:
- Blogging Statistics 2026
- Link Building Statistics 2026
- Digital PR Statistics 2026
- Live Streaming Statistics 2026
- YouTube Creator Statistics 2026
Conclusion: Disney Plus Navigates a Competitive Future
The Disney Plus statistics 2025 reveal a platform in a dynamic state of growth, adaptation, and strategic evolution.
With a strong global subscriber base, robust revenue, and a strategic pivot towards profitability, Disney Plus is a formidable force in the streaming industry.
While it faces intense competition and occasional public relations challenges, its iconic content library, diversified offerings (including ad-supported tiers), and commitment to financial sustainability position it well for continued success.
As the streaming landscape continues to shift, Disney Plus’s ability to innovate, respond to user feedback, and adapt its content strategy will be crucial in maintaining its leading position and delivering magical entertainment to audiences worldwide.


Comments
Be the first to leave a comment.