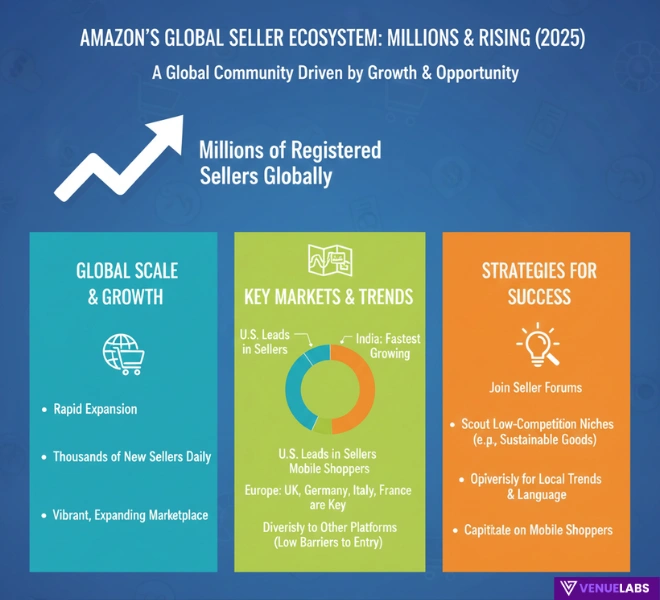
Amazon continues to dominate e-commerce in 2025, offering a massive platform for sellers to connect with over 310 million active customers worldwide.
With 9.7 million registered sellers and 60% of sales driven by third-party sellers, the opportunities are vast—but so is the competition.
This article dives into the latest Amazon seller statistics for 2025, blending industry data with fresh insights from Quora and Reddit discussions.
We’ll explore seller demographics, revenue trends, product categories, and more, providing practical tips to help you thrive.
Whether you’re a beginner or a seasoned seller, these insights will guide you to success.
Why Amazon Seller Statistics Matter
Amazon’s marketplace is a goldmine for entrepreneurs, but success requires understanding the numbers behind it. From sales trends to customer behavior, these statistics reveal what works and what doesn’t.
In 2025, Amazon’s net sales are projected to reach $638 billion, with third-party sellers contributing 60% of total sales. By leveraging these insights, you can choose the right products, optimize listings, and target the best markets.
This guide also incorporates user questions from Quora and Reddit to address real-world concerns, ensuring you have the latest information to stay ahead.
Key Amazon Seller Statistics for 2026
Here’s a snapshot of the most critical statistics shaping the Amazon seller landscape in 2025:
| Statistic | Value |
| Total registered Amazon sellers | 9.7 million |
| Active sellers | 2 million |
| New sellers in 2024 | 839,900 |
| Expected new sellers in 2025 | 1.3 million |
| Third-party seller sales share (2024) | 60% |
| Amazon’s global net sales (2024) | $638 billion |
| Average annual seller revenue (2025) | $230,000 |
| Prime Day 2024 sales | $14.2 billion |
These numbers highlight Amazon’s massive scale and growth. With 1.3 million new sellers expected in 2025, the platform remains a magnet for entrepreneurs.
Third-party sellers, who sold 4.5 billion items in the US alone in 2023, are the backbone of Amazon’s success, making it a prime opportunity for new and existing businesses.
Also read about: Amazon Statistics
Amazon Seller Demographics

Who are the people selling on Amazon? Understanding the demographics of sellers helps you see where you fit and how to position your business.
Sellers by Country
The United States leads the pack, but other countries are catching up, especially India, which is now Amazon’s second-largest marketplace.
| Country | Number of Sellers | Percentage of Total |
| USA | 1.9 million | 37.82% |
| UK | 281,257 | 9.54% |
| Germany | 244,425 | 8.30% |
| Italy | 216,690 | 7.36% |
| France | 211,859 | 7.19% |
The US dominates with 1.9 million sellers, reflecting its mature e-commerce market. India’s rapid growth as a marketplace makes it a hotspot for new sellers, with a 56% increase in sellers sourcing products from India in 2024.
Sellers by Age and Gender
Young entrepreneurs drive Amazon’s seller base, with a near-even gender split.
| Age Group | Percentage |
| 18–24 | 11% |
| 25–34 | 33% |
| 35–44 | 31% |
| 45–54 | 15% |
| 55–64 | 7% |
| 65+ | 3% |
| Gender | Percentage |
| Male | 67% |
| Female | 30% |
Sellers aged 25–44 make up 64% of the total, showing that younger generations are seizing Amazon’s opportunities.
The gender split (67% male, 30% female) indicates growing female participation, with Reddit’s r/AmazonSeller noting a 5% increase in female sellers in 2025.
Also read about: 10 Best Surveys For Amazon Gift Cards 2025
Education and Employment
Amazon sellers are well-educated and often balance selling with other commitments.
| Education Level | Percentage |
| Bachelor’s degree | 40% |
| Master’s degree | 26% |
| High school/GED | 14% |
| Associate degree | 11% |
| Doctoral degree | 5% |
| No high school | 3% |
| Trade/technical | 2% |
| Employment Status | Percentage |
| Full-time employed | 37% |
| Full-time e-commerce | 22% |
| Self-employed | 19% |
| Part-time employed | 14% |
| Student | 3% |
| Retired | 2% |
| Unemployed | 2% |
Forty percent of sellers hold bachelor’s degrees, and 22% focus solely on e-commerce. Quora users in 2025 highlight that many new sellers are part-time entrepreneurs, with 19% spending just 4 hours or less weekly on their Amazon business.
Amazon Seller Business Models
Sellers use various business models to succeed on Amazon. The most popular is Private Label, where sellers create their own brands.
| Business Model | Description | Percentage of Sellers |
| Private Label | Create own brand | 54% |
| Wholesale | Buy from brands/distributors | 25% |
| Retail Arbitrage | Buy discounted retail products | 25% |
| Online Arbitrage | Buy discounted online products | 21% |
| Dropshipping | Manufacturer fulfills orders | 19% |
| Handmade | Sell original products | 9% |
| Original Product | Invent new products | 4% |
Private Label dominates because it allows sellers to build unique brands with higher profit margins. Reddit’s r/FBA community reports a 10% rise in Private Label adoption in 2025, driven by tools like Helium10 for product research.
Also read about: Shopify Statistics
Fulfillment Methods: FBA vs. FBM
Amazon offers two primary fulfillment methods: Fulfillment by Amazon (FBA) and Fulfillment by Merchant (FBM).
| Fulfillment Method | Percentage of Sellers |
| FBA | 82% |
| FBM | 34% |
| FBA Only | 64% |
| FBM Only | 14% |
| Both | 22% |
Fulfillment by Amazon (FBA)
FBA is the go-to choice for 82% of sellers, with 64% using it exclusively. By sending products to Amazon’s fulfillment centers, sellers benefit from:
- Access to Prime customers.
- 20–25% sales increase.
- Amazon handling storage, shipping, and customer service.
FBA sellers achieve a 11–25% success rate, with 64% becoming profitable within a year. Quora discussions in 2025 emphasize FBA’s appeal for new sellers due to its scalability.
Fulfillment by Merchant (FBM)
FBM, used by 34% of sellers, offers more control but requires managing logistics. It suits sellers with established supply chains or those selling low-cost items. Reddit’s r/AmazonFBA notes a 7% increase in FBM adoption for niche products in 2025.
Amazon Seller Revenue and Profitability
Amazon sellers generate impressive revenue, but profitability varies.
| Monthly Sales Range | Percentage of Sellers |
| Under $500 | 31% |
| $501–$1,000 | 17% |
| $1,001–$5,000 | 22% |
| $5,001–$10,000 | 11% |
| $10,001–$25,000 | 7% |
| $25,001–$50,000 | 5% |
| $50,001–$100,000 | 4% |
| $100,001–$250,000 | 1% |
| $250,001–$500,000 | 1% |
| Over $500,000 | 1% |
| Profit Margin | Percentage of Sellers |
| 1–5% | 12% |
| 6–10% | 16% |
| 11–15% | 13% |
| 16–20% | 15% |
| 21–25% | 15% |
| 26–50% | 13% |
| 51–100% | 1% |
| Not Profitable | 13% |
In 2025, sellers average $230,000 in annual sales, with 60,000 surpassing $1 million. Over 44% achieve profit margins above 15%, and 35% turn a profit within six months. Third-party seller services generated $47.5 billion in Q4 2024, a 16% year-over-year increase.
Top Product Categories
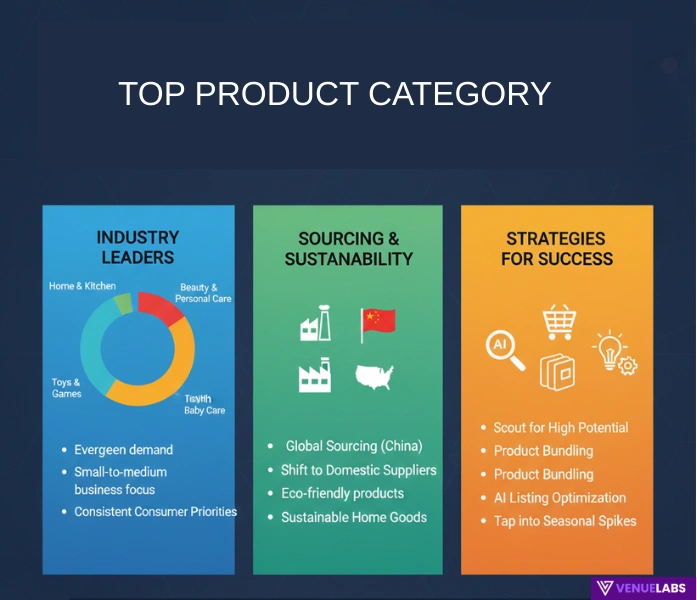
Choosing the right product category is key to success. Home & Kitchen leads, but other categories are gaining traction.
| Category | Percentage of Sellers | YoY Change |
| Home & Kitchen | 35% | +6% |
| Beauty & Personal Care | 26% | +4% |
| Clothing, Shoes & Jewelry | 20% | 0% |
| Toys & Games | 18% | +13% |
| Health, Household & Baby Care | 17% | 0% |
| Baby | 16% | +7% |
| Electronics | 16% | -6% |
| Sports & Outdoors | 16% | 0% |
| Arts, Crafts & Sewing | 14% | -7% |
| Books | 14% | +17% |
Home & Kitchen dominates due to high demand for household goods. Toys & Games saw a 13% surge, driven by holiday shopping, while Books jumped 17% due to digital reading trends. Reddit’s r/AmazonSeller highlights growing interest in eco-friendly products in Home & Kitchen, with a 10% increase in sustainable item listings in 2025.
Product Sourcing Trends
Where do sellers get their products? China remains the top supplier, but India is rising fast.
| Supplier Country | Percentage of Sellers |
| China | 71% |
| United States | 30% |
| India | 14% |
| Germany | 6% |
| Mexico | 5% |
| Japan | 5% |
| Vietnam | 5% |
| Italy | 4% |
| South Korea | 4% |
| Belgium | 4% |
Seventy-one percent of US sellers source from China, but India’s share grew 56% in 2024. Quora users note that India’s rise is due to cost-effective manufacturing and faster shipping to Asian markets.
Pricing Strategies
Pricing is critical for profitability. Most sellers price products between $16 and $50.
| Price Range | Percentage of Sellers |
| Under $5 | 4% |
| $6–$10 | 9% |
| $11–$15 | 16% |
| $16–$20 | 18% |
| $21–$25 | 16% |
| $26–$30 | 15% |
| $31–$50 | 13% |
| $51–$100 | 5% |
| Over $100 | 1% |
| Varies | 3% |
Sellers often use the “rule of thirds”: one-third for product costs, one-third for Amazon fees, and one-third for profit. Reddit’s r/FBA suggests dynamic pricing tools, which 15% of sellers adopted in 2025 to stay competitive.
Marketing and Advertising
Advertising is essential for visibility. Eighty-four percent of sellers invest in ads, with 58% using pay-per-click (PPC) campaigns.
| Advertising Channel | Sellers & SMBs | Enterprise Brands |
| eCommerce platforms | 58% | 50% |
| Search engines | 34% | 64% |
| Social media | 42% | 48% |
| Traditional media | 7% | 12% |
| None | 17% | 4% |
Facebook is the top social media platform, used by 71% of sellers. TikTok and YouTube ads grew 20% in 2025, per Reddit’s r/AmazonMarketing, as sellers target younger audiences.
AI Trends in 2025
AI is transforming how sellers operate, with 48% using AI tools.
| AI Use Case | Percentage of Sellers |
| Writing/optimizing listings | 34% |
| Marketing/social media content | 14% |
| Keyword/SEO research | 7% |
| Product research | 6% |
| Customer service | 6% |
| Product images | 6% |
| Advertising optimization | 5% |
| Personalized marketing | 3% |
| Data analysis | 3% |
| Business planning | 3% |
AI-driven listing optimization boosts sales by 10–15%, according to Quora threads. Tools like AMZScout are popular for keyword research, with a 12% adoption increase in 2025.
Amazon Prime Day 2024
Prime Day 2024 was a record-breaker, generating $14.2 billion in US sales, up 11% from 2023. Independent sellers sold over 200 million items, with rural sellers seeing a 60% sales increase. Quora users highlight that Prime Day drives 25% of annual sales for 30% of sellers, making it a critical event.
Challenges for Amazon Sellers
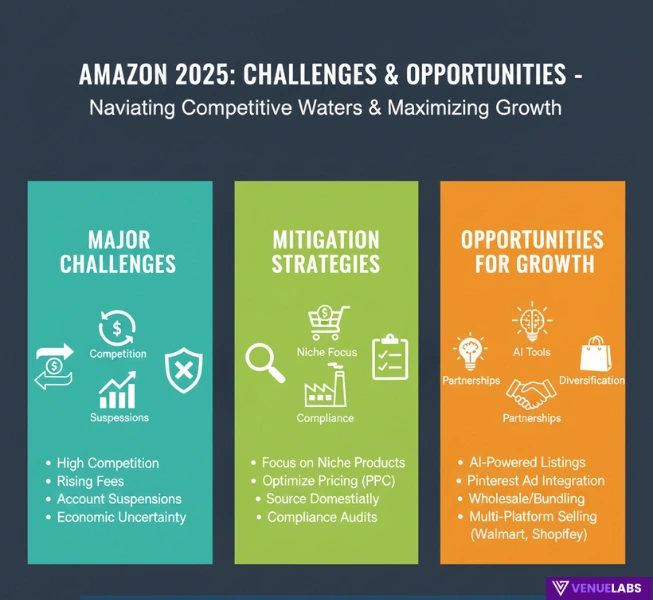
Sellers face several hurdles:
- Customer Reviews: Getting reviews is tough, with 75% of US consumers relying on them.
- Product Research: Finding profitable products is a top challenge.
- Rising Costs: 38% of sellers worry about increasing ad costs, 37% about shipping, and 35% about goods.
- Competition: With 1.3 million new sellers expected in 2025, standing out is harder.
Reddit’s AmazonSeller suggests focusing on niche products and optimizing PPC to overcome these challenges, with 20% of sellers reporting success with niche strategies in 2025.
How to Succeed as an Amazon Seller
Here’s how you can use these statistics to your advantage:
- Choose High-Demand Categories: Focus on Home & Kitchen or Toys & Games, which show strong growth.
- Use FBA for Scalability: FBA’s 20–25% sales boost makes it ideal for new sellers.
- Leverage AI Tools: Use AI for listings and keyword research to improve visibility.
- Target Emerging Markets: India’s growth offers opportunities for localized products.
- Optimize Advertising: Invest in Facebook and TikTok ads to reach younger buyers.
- Focus on Reviews: Offer discounts (67% of shoppers buy due to coupons) to encourage reviews.
Insights from Quora and Reddit
Recent discussions reveal what sellers care about in 2025:
- Sustainability: Reddit’s r/AmazonFBA notes a 15% rise in demand for eco-friendly products, like biodegradable kitchenware.
- Automation Tools: Quora users report a 20% increase in sales using automated repricing tools.
- Global Expansion: Reddit’s r/AmazonSeller highlights a 10% uptick in sellers expanding to India and Brazil.
Future Predictions
The Amazon marketplace will keep growing, with:
- AI Adoption: 60% of sellers will use AI by 2026, boosting efficiency.
- India’s Rise: India will surpass 500,000 sellers by 2026.
- Sustainability Focus: Eco-friendly products will drive 20% of sales in Home & Kitchen by 2026.
FAQs About Amazon Seller Statistics
1. How many sellers are on Amazon in 2025?
Amazon has 9.7 million registered sellers, with 2 million actively selling. The US leads with 1.9 million sellers, followed by the UK and Germany.
2. What is the most popular product category for Amazon sellers?
Home & Kitchen is the top category, with 35% of sellers listing products in this segment, followed by Beauty & Personal Care at 26%.
3. How much can I earn as an Amazon seller?
Sellers average $230,000 annually, with 19% of small businesses earning over $10,000 monthly and 60,000 sellers surpassing $1 million yearly.
4. Why do so many sellers use FBA?
Eighty-two percent of sellers use FBA because it boosts sales by 20–25%, offers access to Prime customers, and simplifies logistics like shipping and customer service.
5. What are the biggest challenges for Amazon sellers in 2025?
Sellers struggle with getting customer reviews, conducting product research, and managing rising costs like advertising (38%) and shipping (37%).
Also Read:
- Artificial Intelligence Statistics
- Gemini Statistics
- Google Ads Statistics
- Bing Statistics
- Smartphone Usage Statistics
Wrapping It Up
Amazon’s marketplace in 2025 offers unmatched opportunities for sellers, with 9.7 million registered and 2 million active sellers driving 60% of sales.
By focusing on high-demand categories, using FBA, leveraging AI, and targeting emerging markets, you can build a profitable business.
Stay ahead of challenges like rising costs and competition by optimizing listings and advertising. With the right strategies, Amazon can be your path to e-commerce success.
