n 2025, income levels across the United States exhibit significant variation, influenced by factors such as location, education, gender, and age.
The average individual salary is estimated at $67,500, while the median individual salary stands at approximately $63,180. Household income, on the other hand, shows a broader range, with median household earnings fluctuating between $78,171 and $83,150.
These statistics highlight the discrepancy between the average and median figures, with the former often skewed by extremely high earners.
Understanding these figures, along with factors like state-specific income differences, demographic influences, and education levels, can provide valuable insight into economic trends and help individuals make informed decisions about career, location, and financial planning.
Individual Salary
- Average individual salary (2025): about $67,500 (SSA, BLS estimates).
- Median individual salary (2025): about $63,180.
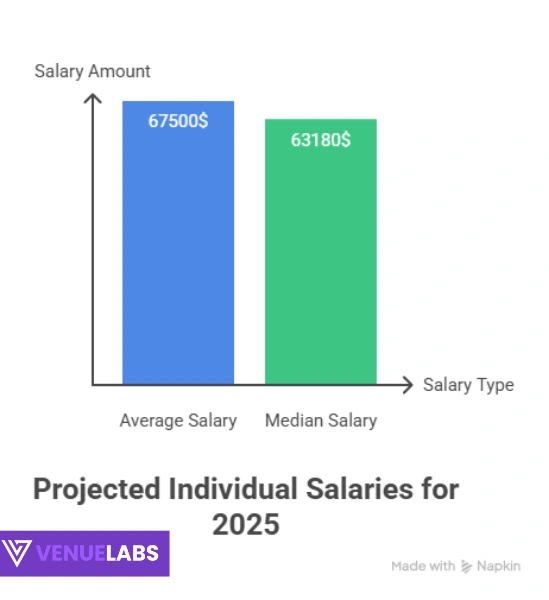
The average is higher than the median because billionaires and very high earners pull the number up. The median is the “middle ground” and shows what typical workers actually make.
Household Income
- Median household income (2025): between $78,171 and $83,150, depending on source.
- Household averages run higher than individual averages because many households have two earners.
Reddit and Quora users point out a common confusion: when people hear “average salary” quoted at $67,500, they sometimes mistake it for household income. But that number is per worker, not per household. For households, the median is closer to $80,000.
Average vs. Median Income: Easy Breakdown
- Average income = add all incomes, divide by number of earners. Can be skewed by ultra-wealthy.
- Median income = the exact middle. Half make more, half make less. Gives a more realistic picture.
Tip for You:
Compare your household to the median. If you’re earning above $80,000, you’re doing better than half of US households in 2025.
Average US Salary And Household Income US Statistics 2025: By State
Location changes everything. Some states push household averages above $85,000 while others remain closer to $50,000.
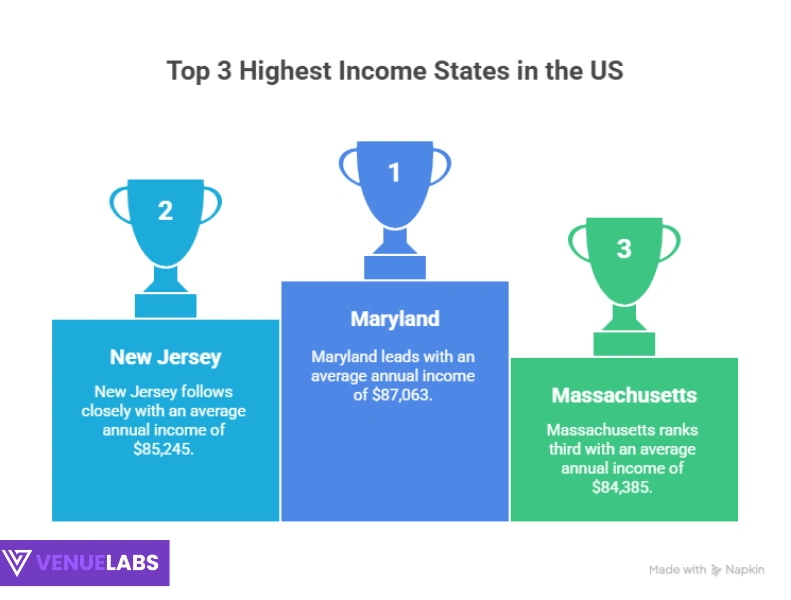
High-Income States (2025)
| Rank | State | Average Annual Income |
| 1 | Maryland | $87,063 |
| 2 | New Jersey | $85,245 |
| 3 | Massachusetts | $84,385 |
| 4 | Hawaii | $83,173 |
| 5 | Connecticut | $79,855 |
| 6 | California | $78,672 |
| 7 | New Hampshire | $77,923 |
| 8 | Alaska | $77,790 |
| 9 | Washington | $77,006 |
| 10 | Virginia | $76,398 |
Low-Income States (2025)
| Rank | State | Average Annual Income |
| 1 | Mississippi | $46,511 |
| 2 | Arkansas | $52,000 |
| 3 | West Virginia | $53,000 |
| 4 | Louisiana | $54,200 |
| 5 | Oklahoma | $54,200 |
Source: Statista
Observation:
- Tech hubs (CA, WA, MA) and finance hubs (NY, NJ) top the charts.
- Rural southern states trail, but cost of living is far lower.
Benefit for You:
If you earn remote big-city pay but live in a cheaper state like Tennessee or North Carolina, you can stretch your money much further.
Why Income Differs by State
- Cost of Living: California and New York salaries are higher because housing and food costs are steep.
- Industry Mix: Tech in California, aerospace in Washington, finance in New York push up salaries.
- Inflation: 2025 inflation sits around 3%, but impacts differ by region.
Household Income by Demographics
Gender
- Men (median, 2025): $67,704
- Women (median, 2025): $56,316
- Gap: $11,388
Women earn about 83 cents per dollar men earn. Discussions on Reddit often center on salary negotiations and switching to higher-paying industries as the fastest way to close the gap.
Age
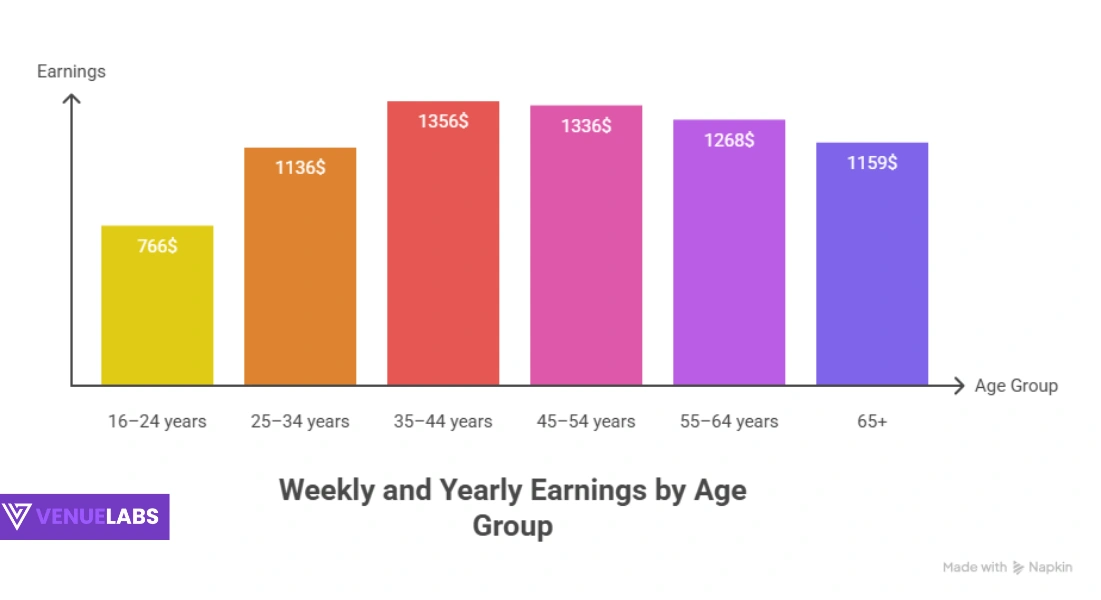
- 16–24 years: $766 weekly ($39,832 yearly).
- 25–34 years: $1,136 weekly ($59,072 yearly).
- 35–44 years: $1,356 weekly ($70,512 yearly). Peak earnings.
- 45–54 years: $1,336 weekly ($69,472 yearly).
- 55–64 years: $1,268 weekly ($65,936 yearly).
- 65+: $1,159 weekly ($60,268 yearly).
Takeaway: Peak earnings happen in your 30s and 40s. After 55, wages flatten or dip.
Race
- Asian households: $113,000 median.
- White households: $84,600 median.
- Hispanic households: $65,500 median.
- Black households: $56,500 median.
Why? Access to education, industries, and systemic barriers.
Benefit Tip: Knowing these stats can strengthen negotiations. If you’re underpaid compared to averages in your field, bring the data to the table.
Education
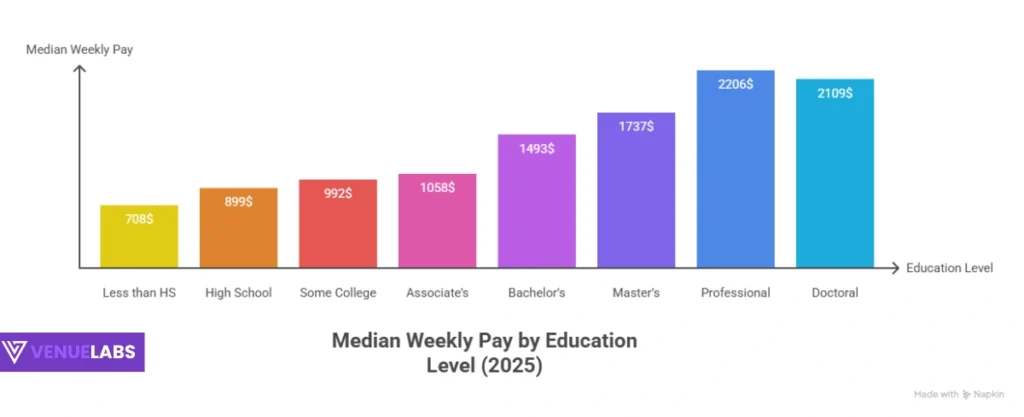
| Education Level | Median Weekly Pay (2025) |
| Less than HS | $708 |
| High School | $899 |
| Some College | $992 |
| Associate’s | $1,058 |
| Bachelor’s | $1,493 |
| Master’s | $1,737 |
| Professional | $2,206 |
| Doctoral | $2,109 |
Takeaway: A bachelor’s degree adds about $600 per week compared to just a high school diploma.
Family Size and Household Income
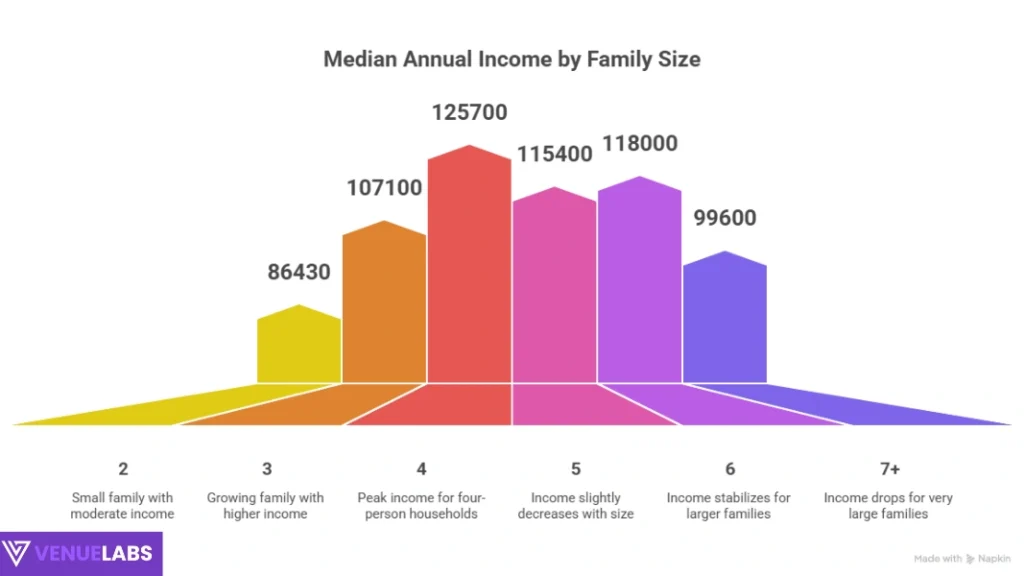
| Family Size | Median Annual Income |
| 2 | $86,430 |
| 3 | $107,100 |
| 4 | $125,700 |
| 5 | $115,400 |
| 6 | $118,000 |
| 7+ | $99,600 |
Four-person households make the most, but costs also rise with family size.
What People Ask on Reddit and Quora 2026
Key Questions
- “What income counts as middle class in 2025?”
Middle class is defined as 2/3 to 2x the median. That means roughly $53,000–$160,000 depending on state. - “Why does it feel harder to live on $80,000 today than $40,000 in the 1990s?”
Housing is the biggest reason. Homes now cost 5.7 years of income, compared to 2.9 years in 1975. - “What salary makes you rich in 2025?”
Most say $150,000+ for individuals, $250,000+ for households. But location matters. - “Is America’s standard of living lower than in the 1950s?”
People debate. Wages rose, but housing, healthcare, and tuition eat into gains.
How to Use Average Household Income US Statistics 2026 for Your Benefit
- Benchmark Yourself: Compare your household income to the national and state medians.
- Plan a Move: High salaries in coastal states may not beat lower salaries in cheaper states. Use cost-of-living calculators.
- Negotiate Better: Use gender, age, and education data to argue for fair pay.
- Invest in Education: Each degree adds significant lifetime income.
- Budget Smart: Apply the 50/30/20 rule (needs/wants/savings).
- Explore Remote Work: Get big-city pay while living in a low-cost state.
- Add a Side Hustle: Freelance or gig work can add 20–30% to household income.
- Stay Policy Aware: Tariffs, taxes, and interest rates directly impact household budgets.
FAQs About Average US Salary
1. How does the gender pay gap impact household income?
Men earn a median weekly income of $1,330, while women earn $1,078. This gap of about $11,388 annually affects dual-income households significantly.
2. Which age group earns the most in 2025?
Workers aged 35 to 44 earn the highest median weekly income at $1,356, followed by those aged 45 to 54 at $1,336.
3. How has household income changed over recent years?
The median household income grew from $77,540 in 2022 to $80,610 in 2023, a 4% increase. It’s projected to continue rising modestly in 2025.
4. How does urban vs. rural location affect household income?
Urban areas like San Francisco have median household incomes up to $150,000 for families of four, while rural areas in the South or Appalachia often see incomes below $35,000 for individuals.
5. What is the median personal income in the US?
The median personal income in 2025 is approximately $44,225, with average personal income at $63,214. This varies by state, with Washington at $84,247 and Mississippi at $48,716.
Also Read:
Conclusion
The average household income US statistics 2025 show a median around $80,000, with wide gaps by state, race, gender, and education.
Some states, like Maryland and Massachusetts, top $85,000, while Mississippi stays below $50,000. Age, education, and demographics shape earnings, but cost of living often matters more than raw salary.
For you, the real value lies in applying these numbers: use them to benchmark, negotiate, relocate wisely, budget better, and plan your career.
