Business owners, marketers, and entrepreneurs constantly search for proven ways to boost online visibility and build trust in a crowded digital world.
Digital PR emerges as a game-changer, blending storytelling with data to secure high-value backlinks, enhance SEO, and foster authentic audience connections.
As 2025 unfolds, digital PR statistics 2025 reveal explosive growth and shifting priorities that directly impact your strategy.
The global digital PR agency market hits $2.985 billion this year, while the full services sector reaches $7.986 billion, signaling massive opportunities for those who act decisively.
You gain a competitive edge by understanding these metrics, from market sizes to campaign effectiveness, and applying them to earn media coverage that drives traffic and revenue.
This guide compiles over 41 key digital PR statistics 2025, enriched with practical tips, community insights from Quora and Reddit, and integrated digital marketing trends to help you implement winning tactics today.
Understanding the Rapid Expansion of the Digital PR Market in 2025
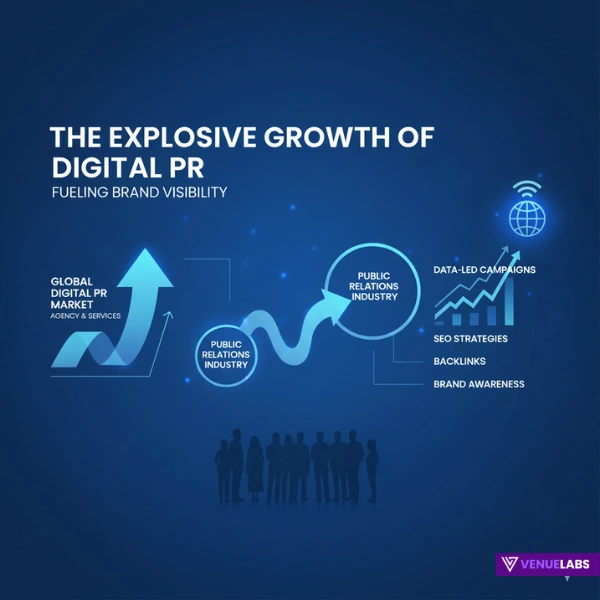
The digital PR landscape transforms rapidly, driven by consumer demands for transparency and search engine algorithms favoring authoritative content. Professionals turn to digital PR statistics 2025 to benchmark success and allocate resources wisely.
The agency market stands at $2.985 billion, reflecting specialized firms that craft campaigns earning placements in top outlets.
Broader services climb to $7.986 billion, encompassing tools, freelancers, and in-house efforts that democratize access.
This aligns with the overall PR industry’s $128.92 billion value in 2024, projected to surge to $304.73 billion by 2033.
Digital channels lead with a 10.03% CAGR from 2025 to 2033, outpacing traditional methods through data integration and real-time analytics.
The services segment grows at 5.7% CAGR, supported by $1.16 trillion in global digital ad spend that amplifies PR reach.
To leverage this, audit your online presence—97% of consumers check it before engaging—and invest 15-20% of your marketing budget in digital PR for compounded growth.
Search interest underscores demand. Monthly Google queries for “digital PR” averaged 3,000-3,600 in 2024, spiking to 3,600 in April. 2025 shows acceleration:
| Month in 2025 | Global Google Searches for “Digital PR” |
| January | 3,300 |
| June | 4,600 |
| July | 5,400 |
| August | 7,600 |
This marks a 120% rise from January 2024 to August 2025, seven times mid-2010s levels of 1,700-1,900.
Forecasted terms like “digital PR” top UK/US searches at 74-84 monthly, ahead of “link building” by 24-32%. Monitor tools like Google Trends to time campaigns, capturing rising interest for backlinks from DR 70+ sites.
Also read about: Link Building Statistics
Core Digital PR Statistics 2026: Key Highlights
Key digital PR statistics 2025 guide decision-making. Data-driven campaigns dominate at 42.3%, favored for shareable insights that attract journalists. In Australia, they hit 57%, proving regional adaptability.
Nearly 90% of experts deem digital PR top for backlinks, with 83.2% noting brand awareness gains and 77.5% seeing traffic/ranking boosts.
AI adoption reaches 80%, impacting research (68%) and writing (52%). Average coverage DR is 61, UR 11, with 20.62% backlinks in DR 70-79.
Positive sentiment appears in 48.5% of articles, highest for expert comments (63.7%). Open rates drop 13% for question subject lines but rise 12% with buzzwords.
| Top Digital PR Statistic | Value |
| Agency Market Size | $2.985 billion |
| Services Market Size | $7.986 billion |
| CAGR (2025-2033) | 10.03% |
| Data-Driven Campaigns | 42.3% |
| Backlink Effectiveness | 89.6% |
| AI Adoption | 80% |
Apply these by prioritizing data campaigns—conduct surveys to generate 19.3%-style polls that secure coverage and links averaging $750 CPL.
Also read about: Latest Digital Marketing Statistics
Diverse Campaign Types and Their Performance in Digital PR
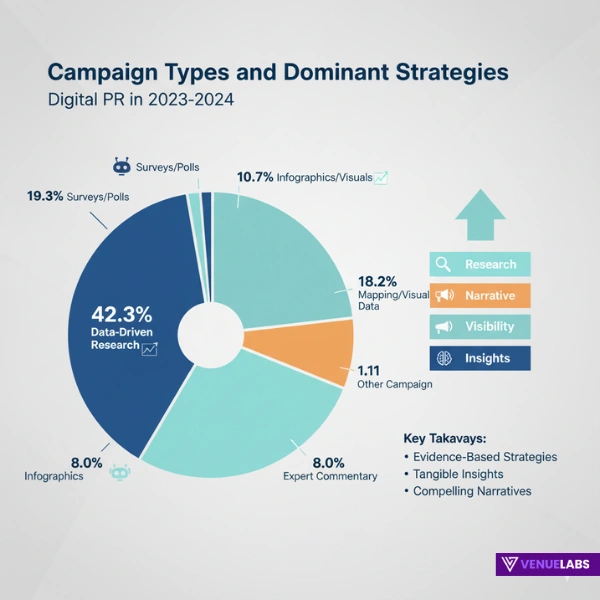
Digital PR encompasses seven main categories, subdividing into 19+ formats.
Data-driven leads at 42.3%, followed by surveys/polls (19.3%), mapping/visual data (18.2%), infographics (10.7%), expert commentary (8.0%), AI-reimagined (0.4%), and others (1.1%).
Regional variations show:
| Region | Data-Driven | Surveys | Mapping | Infographics | Expert | AI | Other |
| UK | 49.4% | 19.2% | 12.0% | 4.5% | 12.9% | 0.5% | 1.4% |
| US | 39.6% | 12.4% | 19.7% | 7.3% | 0.5% | 0.5% | 1.1% |
| Canada | 36.9% | 22.1% | 23.4% | 13.7% | 2.8% | 0.1% | 1.0% |
| Australia | 57.0% | 14.0% | 12.7% | 5.5% | 9.3% | 0.2% | 1.4% |
| Total | 42.3% | 19.3% | 18.2% | 10.7% | 8.0% | 0.4% | 1.2% |
Index studies dominate business/economy (57.12%), AI in tech (28.91%).
For your benefit, match types to goals—use infographics for visuals earning 51% positive sentiment, or expert quotes for 63.7% positivity.
Also read about: SEO Statistics
PR Activity Results and Effectiveness Metrics
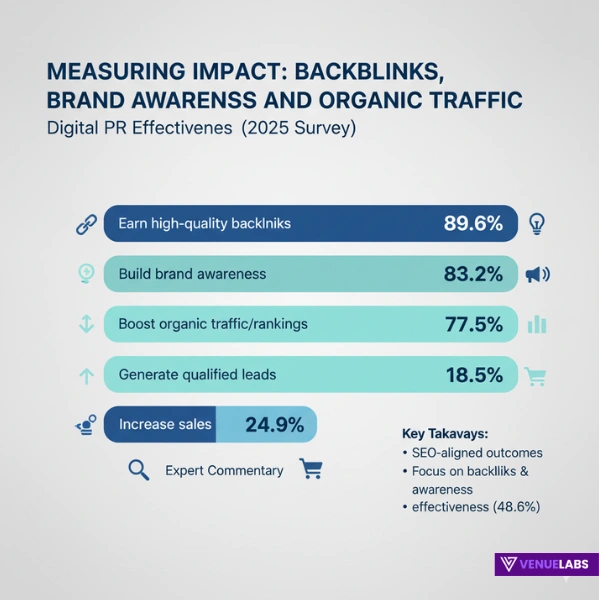
Surveys show 89.6% value digital PR for backlinks, 83.2% awareness, 77.5% traffic/rankings, 24.9% leads, 18.5% sales.
| Impact Metric | Percentage |
| High-Quality Backlinks | 89.6% |
| Brand Awareness | 83.2% |
| Organic Traffic/Rankings | 77.5% |
| Qualified Leads | 24.9% |
| Sales Increase | 18.5% |
48.6% report improved effectiveness yearly. 67.5% link backlinks to SERP gains, 20% cite digital PR as top tactic. Follow links comprise 48%, nofollow 19%. Set KPIs around traffic (22.5% primary) and rankings (19%).
Budget Allocation, Costs, and Compensation in Digital PR
CEOs control 38% of budgets, VPs 18%, others 44%. 66.5% operate under $10,000 monthly:
| Monthly Budget | Percentage |
| <$5,000 | 34.1% |
| $5,000-$10,000 | 32.4% |
| $10,000-$20,000 | 16.2% |
| >$20,000 | 4.0% |
| Don’t Know | 13.3% |
51.4% unknown CPL, average $750. Low-authority links ~$300, high-contextual $500-$2,000. 46.5% spend $5,000-$10,000 monthly on links. US specialists earn $78,520 mean, managers $72,357; UK mean £37,104.
Retainers: Digital $5,000-$10,000 vs. traditional $10,000-$14,500. Start with $3,000-5,000 pilots, track via DR/traffic.
SEO Synergy and Link-Building Impact
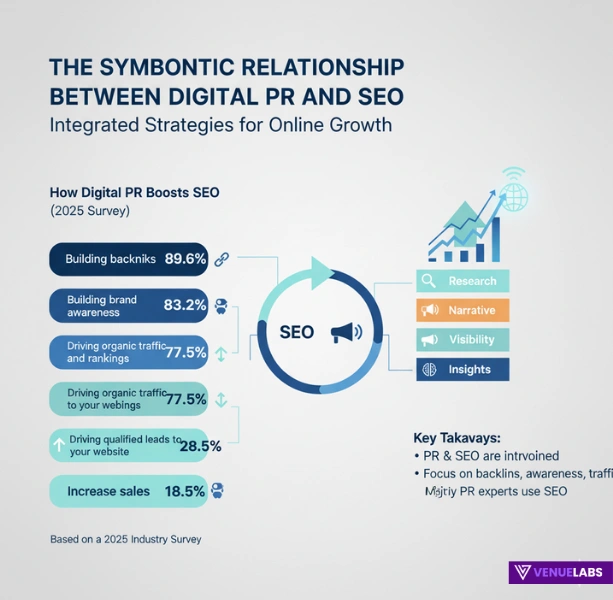
89.6% integrate SEO, 67.3% use for links. 95% pages with zero backlinks get no traffic; top SERPs have 3.8x more. DR correlates stronger than UR. 20.62% digital PR links DR 70-79, 7.83% DR 90+.
| Purpose | Percentage |
| Backlinks | 89.6% |
| Awareness | 83.2% |
| Traffic/Rankings | 77.5% |
93% traffic from search; build 4+ referring domains for 1,000+ monthly visits.
Trending Tactics: Influencers, AI, and Social Integration
93% use influencers, 50% users trust recommendations, 90% reinvest. 91% businesses on social. AI impacts research 68%. 83% use media databases, 62% calendars/monitoring.
| Tool | Usage |
| Calendars | 62% |
| Monitoring | 62% |
| Visualization | 48% |
| Editing | 46% |
| SEO | 43% |
LinkedIn leads B2B leads (40%). Pitch via email (91% preference), follow-ups 3-6 days (54%).
Overcoming Challenges in Digital PR
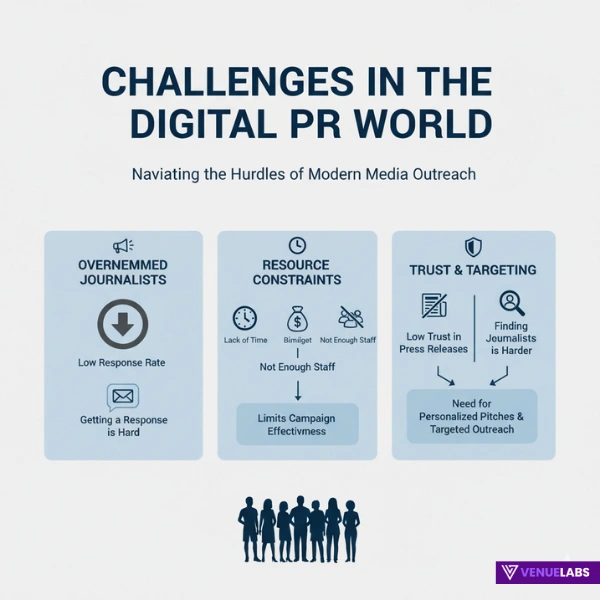
Journalists receive 100+ pitches weekly, 3.3% response. 53% cite response as top barrier, 48% resources, 40% justifying value. 60% find media relations harder. Personalize (20% effective), use buzzwords for +12% opens.
Digital vs. Traditional PR: Cost and Efficacy
Investment priorities: Digital 20%, social 19%. Digital cheaper, faster. Email pitches dominate.
| Approach | Monthly Cost |
| Digital | $5,000-$10,000 |
| Traditional | $10,000-$14,500 |
Hybrid maximizes.
Community Insights from Quora and Reddit on 2025 Digital PR
Reddit’s r/PublicRelations stresses hyper-relevancy—target inner pages, avoid homepage spam.
Users ask about scaling without burnout; solutions include AI for 68% research, niche podcasts over mass outreach. r/DigitalMarketing highlights TikTok news (11% UK uptake), short-form for sentiment positivity.
Quora queries focus on measuring ROI beyond links—use traffic increase (22.5% KPI), integrate with PPC (84% positive).
Emerging: Privacy-compliant first-party data, founder-led authenticity amid AI saturation. Predict social commerce integration, multi-channel consistency.
Implement: Repurpose PR into Reddit threads, collaborate micro-influencers for engagement.
Broader Digital Marketing Ties
Digital ad market $740.3 billion 2024, $786.2 billion 2026. 46% local searches, 28% purchases. PPC: 50% indistinguishable from organic. Video: 86% use, 81% sales impact.
Blend PR with local SEO, influencers for holistic growth.
FAQs About Digital PR Statistics
1. What key market growth figures define digital PR in 2025, and how can businesses capitalize on them?
The digital PR agency market values $2.985 billion, services $7.986 billion, with 10.03% CAGR to 2033; businesses capitalize by shifting 20% budgets to data campaigns (42.3% dominance) targeting 120% search surge for high-DR backlinks.
2. How do different digital PR campaign types perform, and which should I prioritize for backlinks?
Data-driven leads at 42.3%, surveys 19.3%; prioritize data or infographics (51% positive sentiment) for 48% follow links and average DR 61 coverage to boost SEO effectively.
3. What role does AI play in digital PR according to 2025 statistics, and how do I integrate it?
80% adopt AI, impacting research 68% and writing 52%; integrate via tools for list-building and personalization to overcome 3.3% response rates and scale efforts affordably.
4. How much should I budget for digital PR, and what costs yield the best ROI?
66.5% under $10,000 monthly, average CPL $750; yield ROI with $5,000-$10,000 retainers focusing on DR 70+ links (20.62%) and traffic KPIs (22.5%).
5. What challenges persist in digital PR, and what strategies from statistics help surmount them?
53% struggle with journalist responses, 48% resources; surmount via email personalization (91% preference), buzzword subject lines (+12% opens), and media databases (83% usage) for targeted, efficient outreach.
Also Read:
- Metaverse Statistics
- Reddit Statistics
- Smartphone Usage Statistics
- Generative AI Statistics
- Meta AI Users Statistics
Conclusion:
These 41+ digital PR statistics 2025 equip you to craft data-backed, cost-effective campaigns that secure DR 61+ coverage and drive measurable results.
Begin with a budget-aligned data campaign, personalize pitches, and track via traffic/rankings. The outcome delivers amplified visibility, trust, and revenue in 2025’s dynamic arena.
Source: Statista, Business Research Insights
