People look up “google searches per day statistics 2025” to see the huge scale of online searches. They want details on Google’s power. This helps companies improve SEO.
It lets people understand their digital routines. This article mixes data from two key sources. It adds fresh 2025 stats. You get breakdowns by time, device, and search type.
Learn from Quora and Reddit too. Users there ask about AI effects and search counts. Use this to grow your online reach. Build better marketing plans. Track your own search habits.
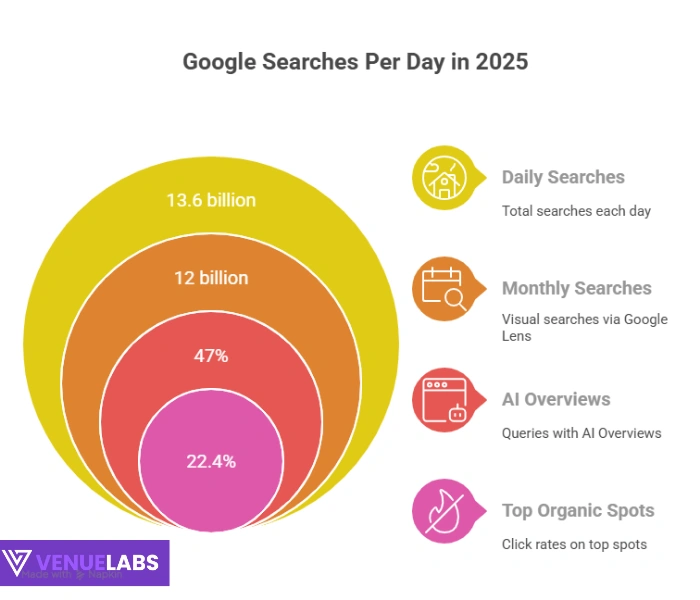
Google deals with giant numbers. In 2025, it handles about 13.6 billion searches each day. Search Engine Land and others report this. It shows growth over years.
AI rivals push back. Daily totals hit 5 trillion yearly. That’s 105,000 searches per second. Folks turn to Google for answers. Firms use it to get seen.
Key Google Searches Per Day Statistics 2026 Highlights
Readers want fast facts. Check these bullets.
- Google processes 13.6 billion searches daily in 2025.
- It breaks to 105,000 searches per second.
- Yearly, over 5 trillion searches happen globally.
- Mobile takes 60% of U.S. searches.
- AI Overviews show in 47% of queries.
- Google grabs 91.5% of the search market.
- Voice searches form 20% of app queries.
- Google Lens does 12 billion visual searches monthly.
- Local searches make 46% of total.
- Top organic spots get 22.4% click rates.
These numbers highlight Google’s grip. Apply them smartly. Optimize for phones. Target local areas.
How Many Google Searches Happen Per Day in 2026?
Google faces massive traffic. Latest data sets it at 13.6 billion per day. Exploding Topics says this for 2025. Semrush reports 9.5 million per minute.
That makes 13.68 billion daily. Other sources like Analyzify note 8.5 billion. SQ Magazine pegs 9.1 billion in April 2025. Visual Capitalist says 13 billion.
Numbers vary. Some stick to 8.5 billion. Mid-2025 trends go higher. More users fuel growth. Better tech helps.
Break it down:
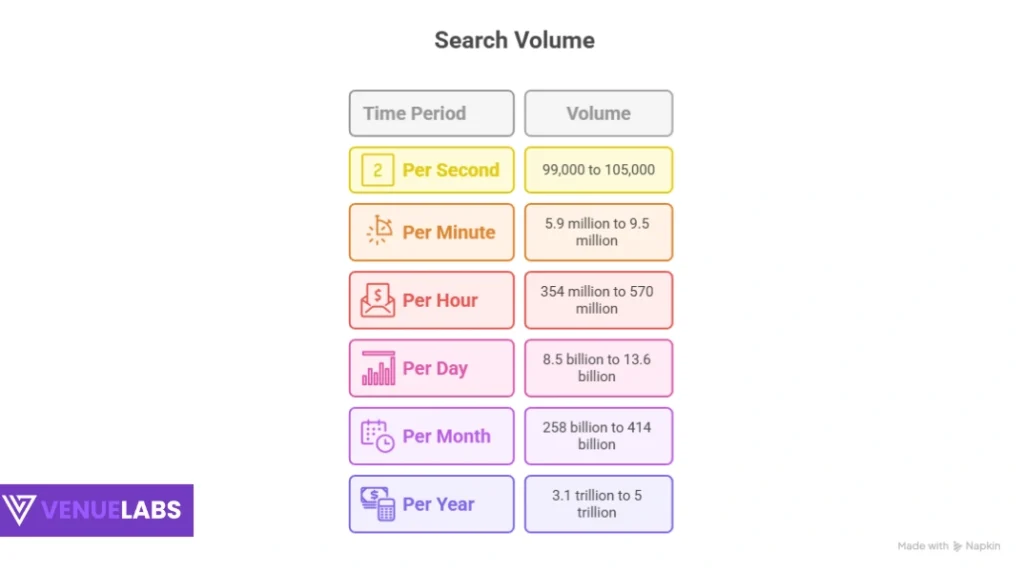
- Per second: 99,000 to 105,000 searches.
- Per minute: 5.9 million to 9.5 million.
- Per hour: 354 million to 570 million.
- Per day: 8.5 billion to 13.6 billion.
- Per month: 258 billion to 414 billion.
- Per year: 3.1 trillion to 5 trillion.
| Time Frame | Estimated Searches (2025 Average) |
| Second | 102,000 |
| Minute | 6.1 million |
| Hour | 366 million |
| Day | 8.8 billion |
| Month | 264 billion |
| Year | 3.2 trillion |
Averages come from sources. Use for plans. Marketers hit busy hours. People cut back on searches.
Historical Growth of Google Searches Per Day
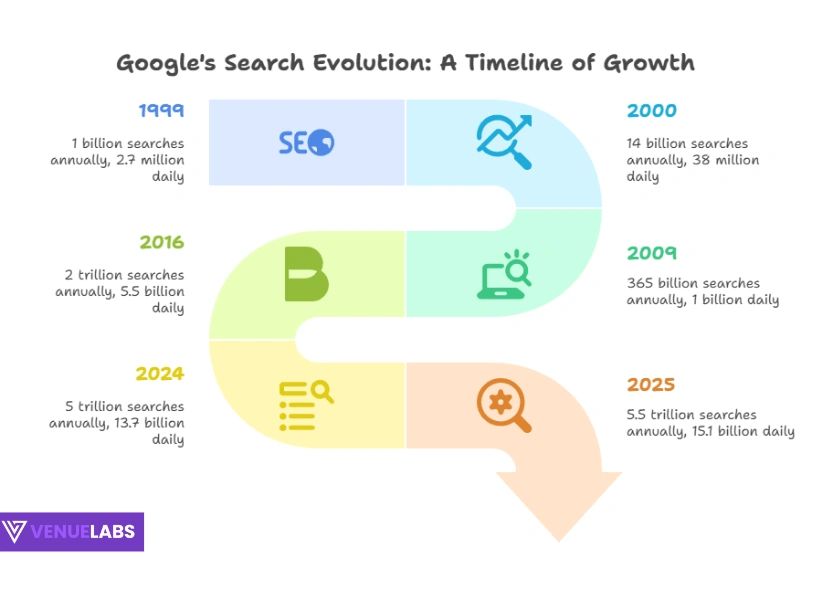
Google began tiny. In 1999, it did 10,000 daily. Now, billions rush in. Internet spread sparked this.
View the table.
| Year | Annual Searches | Daily Average |
| 1999 | 1 billion | 2.7 million |
| 2000 | 14 billion | 38 million |
| 2009 | 365 billion | 1 billion |
| 2016 | 2 trillion | 5.5 billion |
| 2024 | 5 trillion | 13.7 billion |
| 2025 | 5 trillion | 13.6 billion |
From Exploding Topics and others. Growth eases. Numbers still climb. AI adds speed.
Gain from this. Follow patterns. Firms adjust to volumes. Make lasting content.
General Google Statistics for 2026
Google leads big. It holds 91.5% market share.
Query volume hits 10.3 million per something? Wait, per minute? Sources say 5.9 million per minute.
November 2023 saw 83.8 billion visitors. Users stay 10 minutes. View 8.7 pages. Bounce rate 28.1%.
- The U.S. uses it the most. 57% visitors are male. 25-34 age group tops. Largest share in 2024.
- 15% daily searches are new. Ad revenue $191 billion in 2022. 49% ask Google first. 79% visit daily.
- Organic search aids 51% find new items. 99,000 queries per second. 8.5 billion daily. 19% SERPs show images. Desktop visits up 1.4%.
- Americans do 126 unique monthly searches on desktop. 492 billion monthly results. 5 trillion yearly.
- 87% use the default search. 10% images.
Use this. See Google’s role. Shape strategies.
Source: Statista
Google Searches Per Person in 2026
Population 8.2 billion. Internet 5.35 billion active. Google reaches 5.01 billion.
Per person, 1.8 to 2.8 daily. U.S. desktop 4.2 daily. 126 monthly.
Vary by group:
- 34% over 100 monthly.
- 36% 21-100.
- 30% 1-20.
Americans like the homepage 86.94%. Images 10.62%. Video 1.16%.
Apply personally. Cap searches for focus. Target active groups for business.
81% use search monthly. 1/3 do 1-20, 21-100, 100+ monthly.
How Many People Use Google Worldwide?
- 5.01 billion use Google. 89% internet users. Share 91.5%.
- U.S. 27% desktop. India 4.51%. Brazil 4.37%.
- Statista backs this. Benefit: Go global. Tune for the top nations.
Statistics on Popular Google Searches
- 44% branded terms. Generic is more common.
- 52% info intent. Movies, TV, actors, and music are the top topics.
- “Translate” 32.5 million monthly. “Wordle”, “Gmail”, “Weather”.
- “How to” 628,000. “How to tie a tie” 340,000. Health like “lower blood pressure” 160,000.
- Top platforms: “Facebook”, “Amazon”, “YouTube”.
- 14% top 100 sports-related.
- Taylor Swift most searched person, 9.14 million monthly.
- “What to watch” 1.2 million.
- Info queries lost 7.31% CTR for top 4 desktop.
- Commercial no big change.
Benefit: Target popular. Make “how to” guides.
Most Searched Terms on Google in 2026
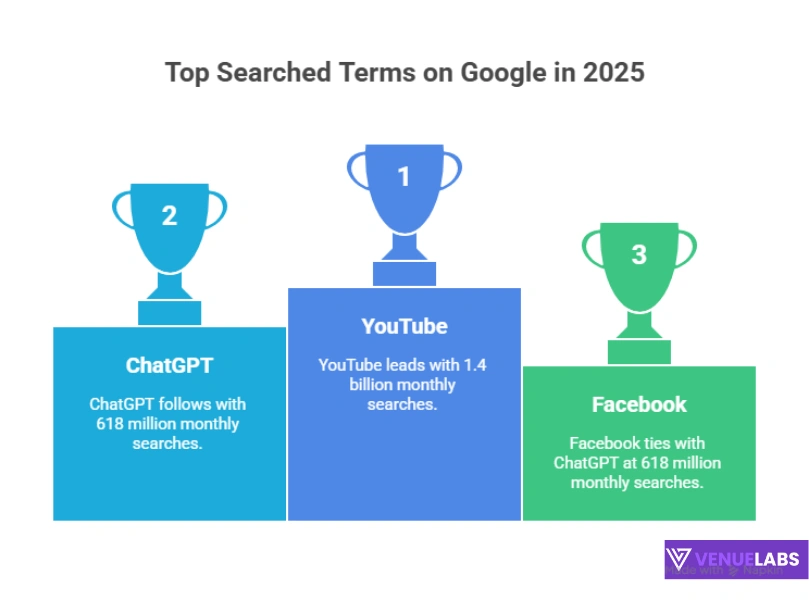
“YouTube” leads. 1.4 billion monthly. “ChatGPT”, “Facebook” 618 million.
Table:
| Rank | Term | Monthly Volume |
| 1 | YouTube | 1.4 billion |
| 2 | ChatGPT | 618 million |
| 3 | 618 million | |
| 4 | Amazon | 176 million |
| 5 | Weather | 148 million |
| 6 | 129 million | |
| 7 | Gmail | 110 million |
| 8 | 109 million | |
| 9 | NBA | 84 million |
| 10 | Translate | 150 million |
Source: StatCounter
From Semrush. Queries 3.4 words average.
Create around these. Drive traffic.
Google User Search Behavior & Click-Through-Rate Statistics
- Sessions last 76 seconds. 25% under 31.
- 58% single term. Most 3-4 words. 10-15 words get 1.76x clicks.
- 45.5% decide 0-5 seconds. 15% modify query.
- Less than 1% second page.
- Top organic 19x more clicks than paid.
- 49% find products via Google.
- 46% local mind.
- Top organic 22.4% CTR.
- 65% positive from 2023 update.
- High backlinks rank best.
- 50% sites with backlink miss first page.
- 3% CTR good.
- Long content ranks 3.5x higher.
- Keywords 3.2-3.5 words.
- 41% domains top 10 stay 6 months.
- 52% info intent.
- 3% queries low impressions.
- 23% use autocomplete.
- 19% product to Shopping click.
- 3% interact PAA, 13.6% purchase.
- Branded outperform.
- 65% click organic.
- 19% click ad, more commercial.
- 50% click in 9 seconds, average 14.6.
- 9% scroll bottom.
- 59% one page, 6% four+.
- 17% return, 5% bounce multiple.
- #1 CTR 27.6%, top 3 54.4%.
- #2 18.7%, #3 10.2%.
- Beyond #10 0.63%.
- Up one spot 32.3% CTR gain.
- #2 to #1 74.5%.
- #8-10 similar, spike #8.
- 40-60 char titles 8.9% better.
- Questions 15% higher.
- Positive 4.1% more.
- Keyword URLs 45% higher.
- 5.35 billion web users.
- 81% search monthly.
Apply: Craft long content. Use questions. Get backlinks.
Google Voice Search Statistics 2026
- Voice rises. 20% app searches.
- 58% local business.
- 41% U.S. adults daily.
- Assistant 88.7 million U.S.
- 81% accurate. Use natural talk.
- Weather, music, news top.
- 50% U.S. used for food delivery.
Optimize voice. Speak like people.
Google Lens and Visual Search Stats
- 12 billion monthly. 4x up from 2021.
- 3,086 per second.
- 32.5% match titles.
- 1/3 top pages.
- Pinterest 7.2%, Amazon 4.1%.
Add alt text. Quality pics.
Google Mobile Search Statistics
- 95.4% mobile market 2024.
- U.S. mobile CTR over 50%.
- Mobile users slower decide.
- 17% sites same rank mobile/web.
- 59% traffic mobile 2022.
- Images 12.5x more mobile.
- Videos 3x.
- 17% no click mobile.
- 60% contact direct.
- Mobile ads 5x effective.
- Short queries +1.94% CTR Q4 2024.
Optimize mobile. Fast sites.
Local and Miscellaneous Google Searches
- 46% local. 3.2 billion daily.
- 37,000 per second local.
- 78% mobile local buy.
- 46% product start Google.
- AI Overviews 13.14%. 7.71% click.
- Claim profiles. 50 calls monthly.
- 42% click Map Pack.
- 86% look up location.
- 58% not optimize local.
- Complete profile 2.7x reputable.
- 63.6% check reviews.
- Posts with titles 2x clicks.
- Non-caps 2x.
- Emojis 2x.
- Text images 4x.
- Non-stock 5.6x.
- CTAs 2.71 clicks.
- Urgency 2.68.
- Open 1.93.
- Awards 1.36.
- Questions 1.23.
- Products 1.04.
- Who we are 1.03.
- Seasonal 0.75.
- Reviews 0.71.
Benefit: Post smart. Add emojis. Get reviews.
SEO Statistics to Leverage Google Searches
First page 75% clicks.
CTR table:
| Position | CTR |
| 1 | 27.6% |
| 2 | 15.8% |
| 3 | 11.0% |
| 4 | 8.4% |
| 5 | 6.3% |
93% start search. Second page <0.63%.
Aim top. Use keyword “google searches per day statistics 2025”.
Google Ads Statistics
- 63% clicked ad lifetime.
- 29% digital spend.
- 73.1% paid market 2019.
- 80% use for PPC.
- $59 billion Q4 2022.
- $10-50 daily new.
- 4/5 want location relevant.
- $4.22 CPC 2023.
- 7.04% conversion 2022-23.
- $8 ROI per $1.
Run ads. Target location.
Statistics on Google’s AI Overviews & Organic Results
- 47% queries AI Overviews.
- 51% desktop SERPs both ads/AIO.
- AIO average 157 words.
- 90% cite 8 or less.
- 99% <328 words.
- 52% sources top 10.
- 119 words desktop, 91 mobile.
- 82% <1000 search volume.
- 35% questions.
- How, what, is common.
- 21% short para.
- Structure content.
- Query in 5.4%.
- 99% sources once.
- Top domains higher traffic 69%.
- Top URL in 46% desktop.
- 50%+ no top organic.
- Niches: Relationships 46.14%, Food 33.46%.
- Pets, Health >60% AIO/ads.
- Ecom 0.3%.
- Spike Q4 2024 8.83%.
Create structured. Get cited.
Statistics on Google’s AI Overviews & Paid Results
- 5% SERPs ads/AIO overlap.
- Text ads bottom 69.44%.
- Shopping below 86.97%.
- Low CPC trigger 23.26%.
- Ads with AIO drop 52% to 13.51%.
- Testing ads in AIO May 2024.
- 3-4 word queries most.
Target low competition.
AI-Focused Google Search Trends 2026
- AI shifts search. Overviews to 47%.
- 5 sources average.
- Circle to Search 200 million. 10% starts.
- Post-ChatGPT traffic -7.91%. Still leads.
Make AI-ready content. Depth matters.
Desktop vs. Mobile Behavior
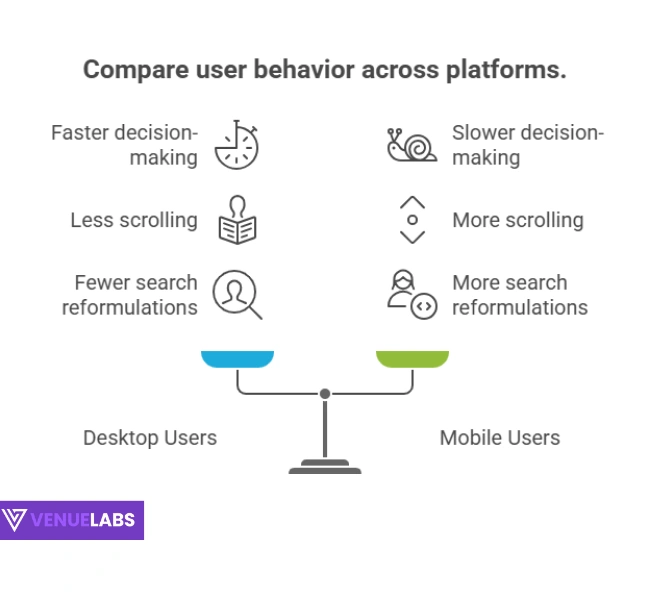
- Desktop 45% decide 5 secs. Mobile 33%.
- Mobile scroll more. Reformulate 29.3%.
- U.S. desktop 27%.
- Design responsive.
Consumer Behavior and Shopping Stats
- 51% product start Google.
- Ads influence most, not Gen Z.
- 3D 50% more clicks. Graph 35 billion.
- Local 75% use for info. 20% daily.
- “Near me” up 100%.
Paid Search Insights
- 700% ROI. $8 per $1.
- 6.96% conversion. Auto/pets 12%.
- Legal $210 CPC.
- Mix paid/organic.
Latest from Quora and Reddit on Google Searches Per Day 2026
- Users seek fresh. On Reddit, posts note AI drops share below 90%. ChatGPT 1B vs Google 373x. Searches worse with bots.
- Quora: Worldwide 8.5B/day. Per user 3-4. Total ever trillions.
- X: 13.7B vs ChatGPT 1B. 16.4B March.
- Worries: AI hurts quality. 75% revenue search.
- Join talks. Fix pains. Adjust content.
- New from searches: Users ask if 8.5B accurate. Debate AI takeover. Reddit threads on declining quality 2025.
- Quora questions: Exact daily? Impact on privacy?
Benefit: Engage communities. Get insights.
How to Use Google Searches Per Day Statistics 2026 for Your Benefit
Data drives moves. See how.
- Businesses: Hit local. Claim profile. Earn calls.
- SEO: Voice/Lens optimize. 3-4 words.
- Marketers: Ads run. High ROI. Mobile focus.
- People: Habit track. My Activity use.
- Creators: Top terms cover. Visuals add.
- Investors: AI watch. Revenue grows.
Reddit: Organic less relevant. Quora: 3.5B mind-blowing.
Act now. Grow visibility.
FAQs About Google Searches Statistics
1. What are the most searched terms on Google in 2025?
Popular search terms include “YouTube” with 1.4 billion monthly searches, “ChatGPT” with 618 million, and “Facebook” with 618 million.
2. How many unique searches does Google see daily?
About 15% of Google’s daily searches, or roughly 1.3 to 2.5 billion, are completely new queries never seen before.
3. How does Google’s search volume compare to past years?
Google’s search volume grew from 1 billion searches per year in 1999 to 5.9 trillion in 2025, a massive jump driven by internet access and mobile use.
4. How many searches end without a click?
Around 27.2% to 60% of Google searches in 2025 are “zero-click,” meaning users find answers directly on the search results page.
5. How much revenue does Google make from search ads?
Google earns about $190 billion to $273.37 billion from search ads in 2025, with search ads making up 70% of its ad revenue.
Also Read:
- Email Marketing Statistic
- Instagram Statistics
- Semrush AI Statistics
- Social Media Statistics
- Facebook Statistics
Conclusion: Google Searches Per Day Stay Huge in 2026
In 2025, Google continues to handle an enormous number of searches every day, with billions of queries processed daily.
While AI and bots are raising concerns about search quality, Google remains the dominant search engine, with users worldwide still relying heavily on it.
As debates grow around AI’s impact and privacy issues, it’s important to stay engaged with these conversations, understand users’ needs, and adjust content strategies to stay relevant.
