Google powers the way people find information online. In 2025, it processes billions of searches every day. People turn to Google for everything from quick facts to shopping ideas.
Businesses use these searches to reach customers. This article dives deep into google searches per day statistics 2025. You will learn the numbers, trends, and ways to benefit from them.
We mix facts with tables for easy reading. We also include fresh insights from Quora and Reddit users. These show what people discuss now about Google’s search volume.
Google stays on top despite new AI tools. It handles massive queries daily. Understanding these stats helps you optimize your online presence.
For example, if you run a website, you can target popular searches. If you market products, you can focus on mobile users. Let’s start Google Searches Statistics 2025 with the top highlights.
Key Google Searches Per Day Statistics 2026 (Top Picks)
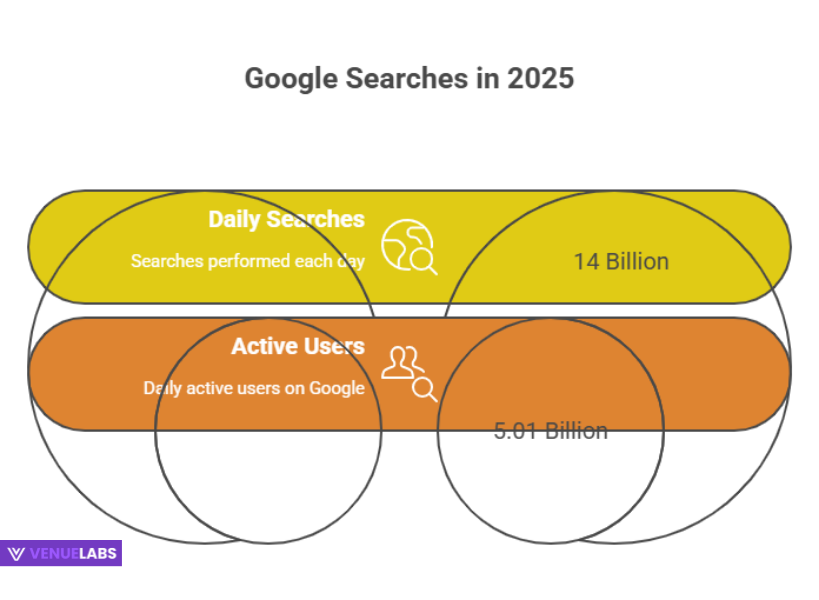
Experts estimate Google processes between 14 billion and 16.4 billion searches per day in 2025. This range comes from various sources that track global trends.
Google handles around 162,000 to 189,815 searches every second. Annually, this adds up to 5.1 trillion to 5.9 trillion searches worldwide. About 5.01 billion to 5.06 billion people use Google globally. Google holds a 89.57% to 90.14% share of the search engine market.
These numbers show Google’s dominance. Businesses pay attention because high search volume means more opportunities. For instance, if your site ranks high, you get free traffic. Now, we break down the daily searches in detail.
How Many Google Searches Happen Per Day?
Google processes over 16.4 billion searches per day based on the latest 2025 data. Some projections put it at 13.6 billion, but trends suggest it’s closer to the higher end.
This equals about 189,815 searches per second. People search for news, products, and answers constantly. Google does not release exact figures often. The last official update came in 2016, when it handled at least 2 trillion searches per year. Since then, volume grew by over 150%.
You can use this info to plan your day. Peak search times happen during work hours in major regions. If you post content then, more people see it. Here’s a detailed breakdown in a table:
| Time Frame | Estimated Google Searches |
| Per Second | 189,815 |
| Per Minute | 11.4 million |
| Per Hour | 684 million |
| Per Day | 16.4 billion |
| Per Month | 492 billion |
| Per Year | 5.9 trillion |
- Also read about: Internet User Statistics
This table shows the scale. Imagine 11.4 million searches in one minute. That’s like a city’s population asking questions at once. Businesses track these to run ads effectively. For example, e-commerce sites boost promotions during high-search hours.
Historical Growth of Google Searches
Google started small. In 1998, it handled just 10,000 searches per day. By 1999, that jumped to over 1 billion per year. Growth sped up as internet access spread. In 2000, searches reached 14 billion annually. From 2001 to 2003, it hit 55 billion. The rise continued through the 2000s.
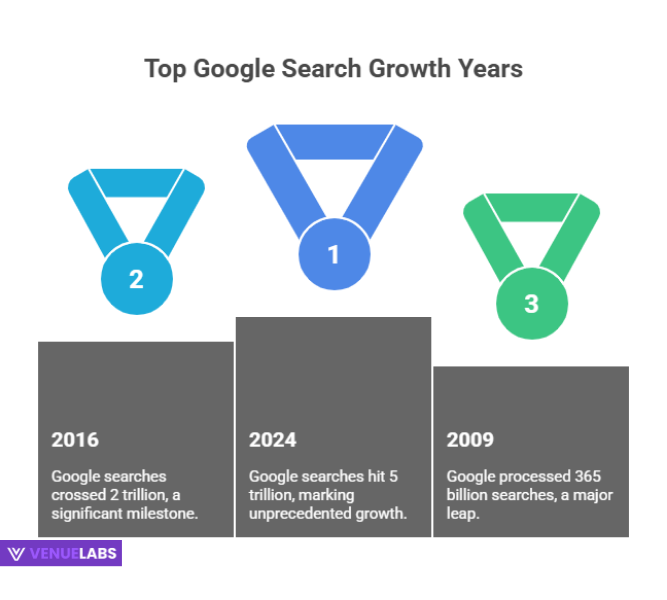
By 2009, Google processed 365 billion searches per year. From 2012 to 2015, it soared to 1.2 trillion. In 2016, it crossed 2 trillion. Recent years show even faster growth. In 2024, estimates put it at 5 trillion. For 2025, it’s projected at 5.9 trillion.
Here’s a table tracking the estimated annual searches by year:
| Year | Estimated Annual Google Searches |
| 1998 | 3.65 million (about 10,000 per day) |
| 1999 | 1 billion |
| 2000 | 14 billion |
| 2001–2003 | 55 billion |
| 2004–2008 | 73 billion |
| 2009 | 365 billion |
| 2012–2015 | 1.2 trillion |
| 2016–2023 | 2 trillion |
| 2024 | 5 trillion |
| 2025 | 5.9 trillion |
Source: Search Engine Land
This growth mirrors internet expansion. More smartphones mean more searches. You can benefit by studying past trends. For example, voice search grew with smart devices. Plan your content for future rises in mobile and AI searches.
Google Searches Per Person
People search on Google about 2.8 times per day on average. With 5.65 billion internet users, this comes from 16.4 billion daily searches. In the US, desktop users average 4.2 searches per day, or 126 per month.
Behaviors vary. Some 34% of people do over 100 searches monthly. Another 36% search 21 to 100 times. The rest, 30%, do 1 to 20.
Americans mostly use the main Google page for 86.94% of searches. Images take 10.62%, videos 1.16%, maps 0.64%, news 0.38%, shopping 0.23%, and web 0.04%. The median US user searches 1.8 times per day, but heavy users pull the average up.
You can use this for personal gain. If you create content, target heavy searchers. They seek detailed info. Businesses analyze demographics to tailor ads. For instance, young people search more on mobile.
How Many People Use Google?
Over 5.01 billion people use Google in 2025. With 5.65 billion internet users, this gives Google a huge reach. Its market share stands at 89.57% globally. Some countries ban Google, like China with 1 billion internet users. Iran and Syria also restrict it.
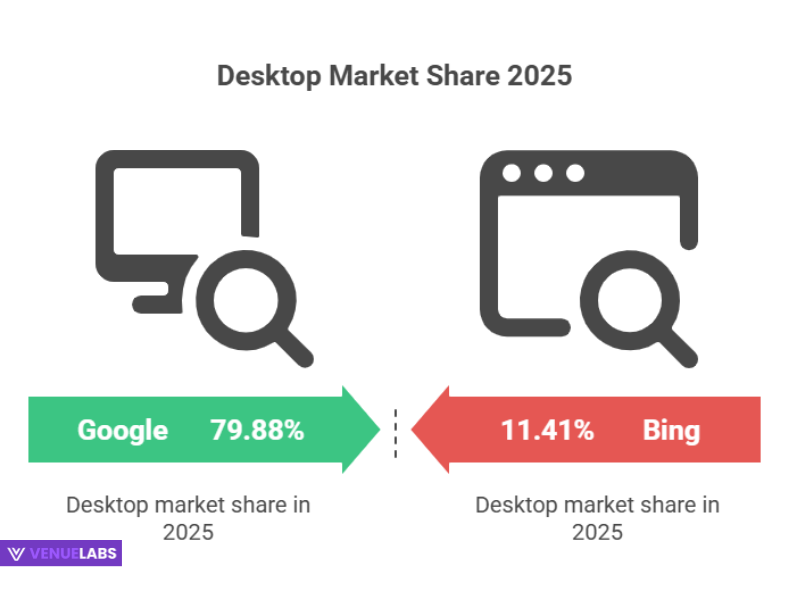
Google’s share dipped from 91.47% in 2024 to 89.57% in 2025. AI tools cause this slight drop. Still, Google leads. On mobile, it holds 93.85% share. Desktop share fell from 88.10% in 2015 to 79.88% in 2025.
Here’s a table of Google’s desktop market share over time compared to competitors:
| Year | Bing | Yahoo | Yandex | Others | |
| 2015 | 88.10% | 4.53% | 4.13% | 0.35% | 2.89% |
| 2016 | 88.36% | 4.85% | 3.30% | 0.57% | 2.92% |
| 2017 | 89.06% | 4.59% | 3.08% | 0.58% | 2.66% |
| 2018 | 87.35% | 5.79% | 3.07% | 0.59% | 3.20% |
| 2019 | 89.95% | 3.99% | 2.84% | 0.39% | 2.84% |
| 2020 | 87.35% | 5.53% | 2.83% | 0.42% | 3.89% |
| 2021 | 85.86% | 6.84% | 2.76% | 0.69% | 3.85% |
| 2022 | 85.55% | 7.61% | 2.85% | 1.43% | 2.57% |
| 2023 | 84.69% | 8.85% | 2.59% | 1.31% | 2.56% |
| 2024 | 81.95% | 10.51% | 2.67% | 2.42% | 2.45% |
| 2025 | 79.88% | 11.41% | 3.05% | 2.59% | 3.07% |
Source: Statista, Stats Counter
Bing gained ground with AI features. You can switch to alternatives if Google doesn’t fit. But most stick with Google for its speed.
- Also read about: Google Ads Statistics
Most Searched Things on Google
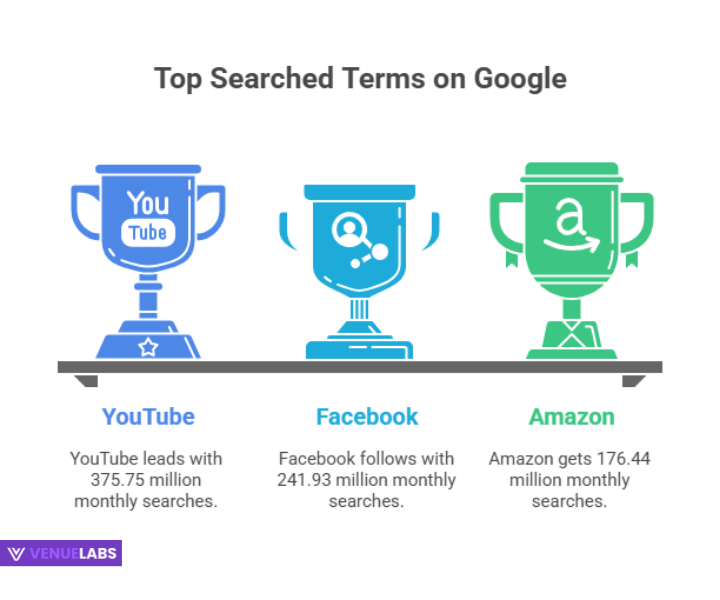
“YouTube” leads with 375.75 million monthly searches. Facebook follows at 241.93 million. Amazon gets 176.44 million. These show social and shopping trends. ChatGPT ranks high at 125.74 million, reflecting AI interest.
Here’s a table of the top 10 most searched terms:
| Rank | Search Term | Average Monthly Search Volume |
| 1 | youtube | 375,751,580 |
| 2 | 241,926,500 | |
| 3 | amazon | 176,446,250 |
| 4 | translate | 150,472,990 |
| 5 | weather | 147,678,760 |
| 6 | 129,303,360 | |
| 7 | chatgpt | 125,739,030 |
| 8 | gmail | 110,366,650 |
| 9 | whatsapp web | 109,074,380 |
| 10 | nba | 84,255,310 |
Target these terms in your content. For example, if you sell on Amazon, optimize for related searches. This drives traffic.
Google Voice Search Statistics
Voice searches make up almost 1 in 5 Google queries. People find it convenient. Google Home answers with 81% accuracy. Over 20% of Google App searches use voice. 58% of consumers find local businesses this way. 41% of US adults use voice daily.
Google Assistant has 500 million monthly users. In the US, it reaches 85.4 million in 2023, projected to 88.7 million in 2025. It beats Siri and Alexa.
Optimize your site for voice. Use natural language in content. Answer questions directly. This helps you rank in voice results.
Google Lens Search Statistics
Google Lens handles over 3,086 searches per second. Monthly, it processes 12 billion visual searches. Users identify objects, extract text, and translate.
Lens spots up to a billion items. 32.5% of Lens results match keywords in page titles. One-third come from top 25% of web pages. Pinterest supplies 7.2%, Amazon 4.1%. Add images to your site with alt text. Use keywords in titles. This boosts visibility in Lens searches.
Mobile Searches on Google
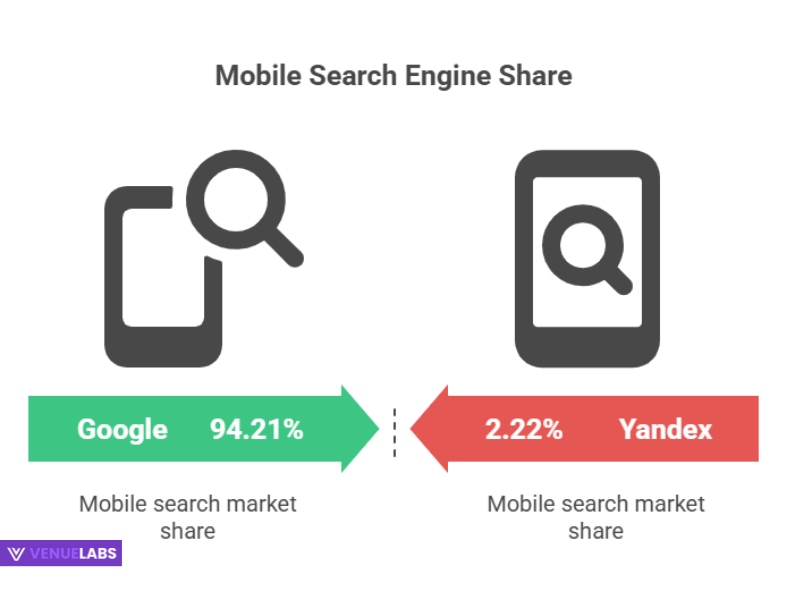
60% of Google searches come from mobiles. Volume doubled in five years. Google holds 94.21% of mobile search market. Yandex has 2.22%, Baidu 0.87%.
Here’s a table of mobile search engine shares:
| Mobile Search Engine | Share |
| 94.21% | |
| Yandex | 2.22% |
| Baidu | 0.87% |
| Bing | 0.75% |
| Yahoo! | 0.63% |
| DuckDuckGo | 0.57% |
63% of US organic traffic is mobile. First mobile result gets 26.9% CTR. Make your site mobile-friendly. Use responsive design. This captures more searches.
Miscellaneous Google Search Statistics
46% of monthly searches have local intent. That’s 97 billion local searches monthly, or 3.2 billion daily. 78% of local mobile searches lead to offline buys. 90% happen in stores.
46% of product searches start on Google. But Amazon leads with 54%. AI Overviews appear in 13.14% of searches, up from 6.49% in January 2025. Only 7.71% click AI links, 8.5% trust them.
Use local SEO. Claim Google Business Profile. Add location keywords. This attracts nearby customers.
SEO Statistics to Leverage Google Searches
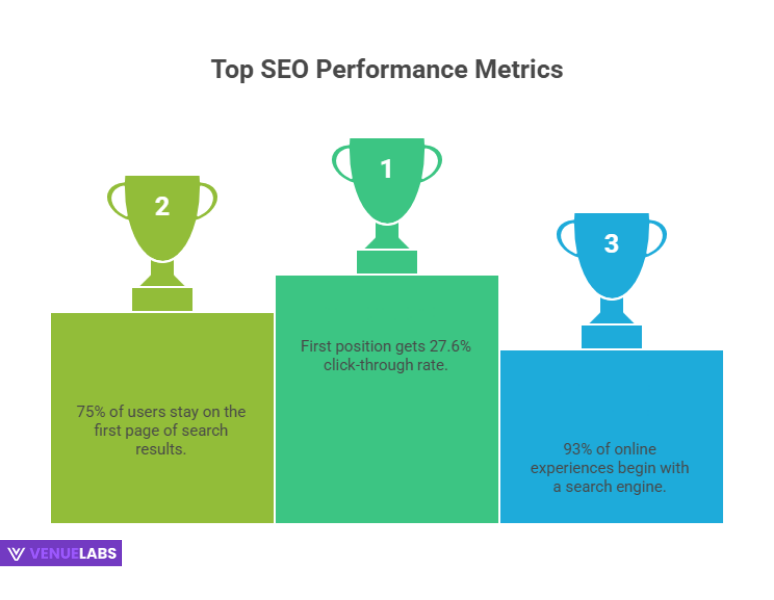
Only 0.63% click second page results. First position gets 27.6% CTR. 75% stay on first page. 93% of online experiences start with search.
Here’s a table of CTR by position:
| Position | CTR |
| 1 | 27.6% |
| 2 | 15.8% |
| 3 | 11.0% |
| 4 | 8.4% |
| 5 | 6.3% |
| 6 | 4.9% |
| 7 | 3.9% |
| 8 | 3.3% |
| 9 | 2.7% |
| 10 | 2.4% |
Aim for top spots. Use keywords like “google searches per day statistics 2025”. Create quality content. Build backlinks. This increases visibility.
Google Usage by Region
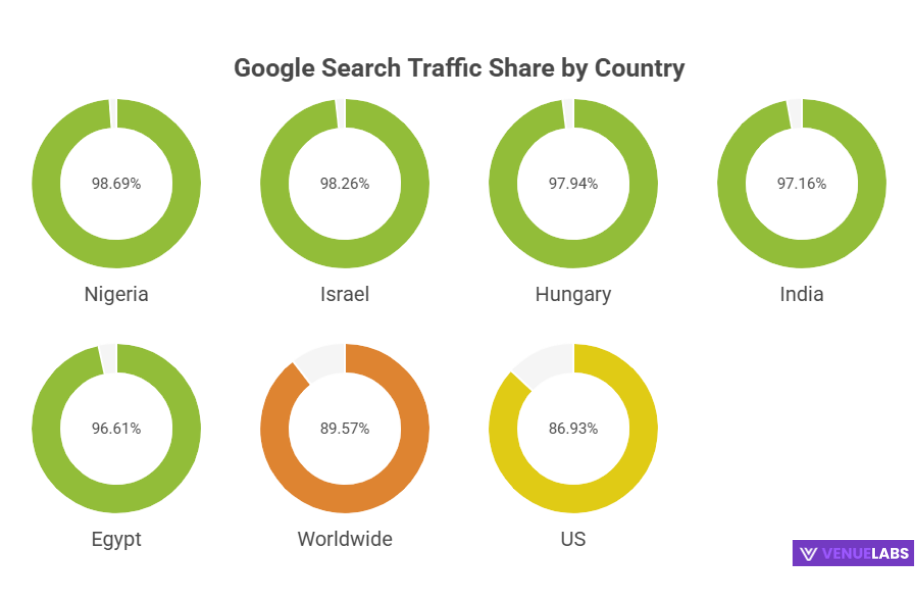
US drives 20.98% of Google traffic. Japan 6.68%, India 5.59%. Nigeria sees 98.69% search traffic from Google. Israel 98.26%, Hungary 97.94%.
Major countries:
| Country | Google Search Traffic Share |
| Nigeria | 98.69% |
| Israel | 98.26% |
| Hungary | 97.94% |
| India | 97.16% |
| Egypt | 96.61% |
| US | 86.93% |
| Worldwide | 89.57% |
Tailor content to regions. Use local languages. Focus on high-dominance areas for ads.
Google Search User Demographics
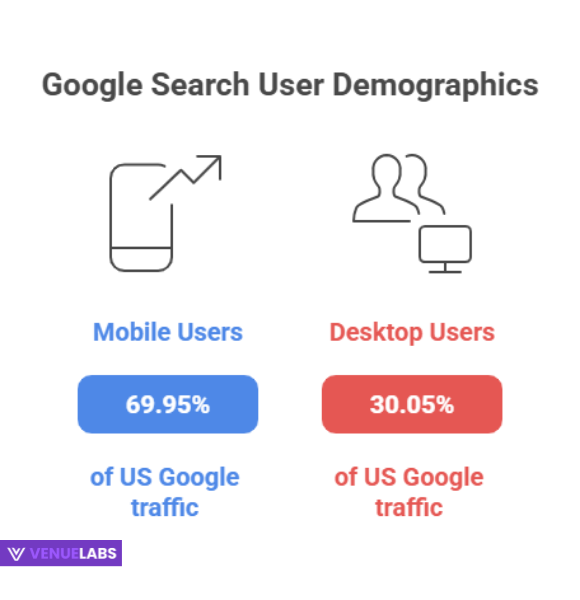
69.95% of US Google traffic is mobile. Males make 64.78%, females 35.22%. But varies by domain. Over 55% of users are 18-34 years old.
Age breakdown:
| Age Group | Percentage |
| 18-24 | 27.7% |
| 25-34 | 27.68% |
| 35-44 | 19.01% |
| 45-54 | 12.68% |
| 55-64 | 7.23% |
| 65+ | 4.76% |
Target young males on mobile. Use visuals and short content.
Types of Google Searches
44.19% are for brands. Intent: Informational 52.65%, Navigational 32.15%, Commercial 14.51%, Transactional 0.69%.
Latest Discussions from Quora and Reddit on Google Searches Per Day
Users on Quora ask about global searches. They estimate 8.5 billion per day. Average user does 3-4 searches daily. On Reddit, people discuss Google’s share drop due to AI.
ChatGPT handles 1 billion daily, but Google does 373 times more. Users complain about worse results in 2025. Bots and AI fluff bury good info. Many add “reddit” to searches for real answers. Others switch to Perplexity or ChatGPT.
These talks show concerns. Quality matters more. You can benefit by creating authentic content. Avoid AI spam. Engage on Reddit for feedback.
How You Can Use Google Searches Per Day Statistics for Your Benefit
These stats offer big opportunities. Businesses optimize SEO to rank high. Use tools like Semrush for keywords. Target voice and Lens with natural phrases and images.
For marketing, run ads during peaks. Focus on mobile for 60% searches. Local SEO brings offline sales. Track demographics to personalize.
Individuals learn habits. Limit searches to avoid overload. Use data to find better info faster.
If you blog, write on trends like ChatGPT. This attracts searchers. Monitor AI impact. Google’s dip shows diversify to Bing or AI tools.
In 2025, AI changes search. 84.58% use AI more than last year. Prepare by blending traditional SEO with AI optimization.
FAQs About Google Searches Statistics
1. How many searches does Google process per day in 2025?
Google processes an estimated 16.4 billion searches per day in 2025, based on the latest data from various analytics sources.
2. What is the average number of Google searches per person?
The average person conducts about 2.8 searches on Google per day, though this varies by region and demographics.
3. How has Google's search volume grown over the years?
Google’s search volume grew from 10,000 per day in 1998 to over 16.4 billion in 2025, showing massive expansion due to internet growth.
4. Why are mobile searches important for businesses?
Mobile searches make up 60% of all Google queries, so businesses must optimize sites for mobiles to capture more traffic and improve user experience.
5. What impact is AI having on Google searches?
AI tools like ChatGPT handle 1 billion searches daily, causing Google’s market share to dip slightly, but Google still dominates with billions more searches.
Also Read:
- Affiliate Marketing Statistics
- Cryptocurrencies Statistics
- DeepSeek AI Statistics
- Twitch Statistics
- Podcast Statistics
Conclusion
In 2025, Google processes around 16.4 billion searches per day, serving over 5 billion users worldwide. Its dominance continues across mobile, desktop, and voice searches, offering huge opportunities for businesses and content creators.
By optimizing for SEO, mobile, local searches, and emerging AI trends, you can reach more users, drive traffic, and stay ahead in the ever-evolving search landscape.
