The smartphone world often feels like a tale of two titans: Apple’s iPhone, running its exclusive iOS, and the vast universe of Android devices, powering phones from countless manufacturers.
For years, users have fiercely debated which ecosystem reigns supreme, and in 2025, this rivalry continues to shape how we connect, work, and play.
Understanding the latest iPhone vs Android statistics 2025 is not just about bragging rights; it’s about making informed decisions that benefit your daily life, your wallet, and your overall digital experience.
This in-depth article explores the current landscape of iPhone versus Android, examining global and regional market shares, user demographics, app ecosystems, and spending habits.
We are diving deep into the numbers to help you understand which platform aligns best with your needs, all while answering pressing questions from communities like Quora and Reddit.
The Global Battleground: Market Share and User Base
The sheer scale of both iPhone and Android is astounding. More than 1 billion active iPhones and over 3 billion active Android devices are currently in use worldwide.
This massive user base fuels a competitive landscape where innovation is constant and user experience is paramount.
Android’s Global Dominance
Globally, Android maintains a commanding lead in the smartphone market.
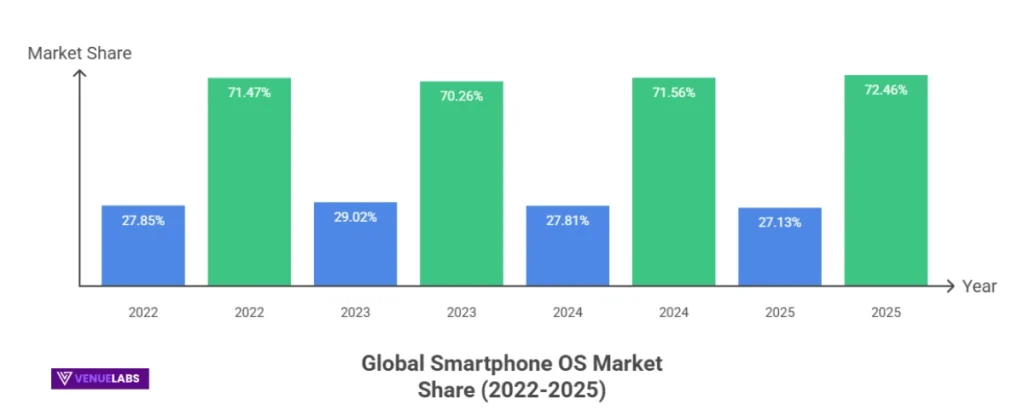
As of July 2025, Android boasts a significant 72.46% market share worldwide, solidifying its position as the most widely used mobile operating system.
Apple’s iPhone (iOS) captures a respectable 27.13% of the global market.
Android first took more than half of the mobile operating system market in 2015, with a 53.65% share, and has steadily grown its dominance ever since.
This widespread adoption means more device choices, often at more accessible price points, for users around the globe.
Let’s look at the global market share breakdown over time:
| Year | iPhone (iOS) | Android |
| 2009 | 34.01% | 2.41% |
| 2010 | 25.48% | 8.82% |
| 2011 | 22.29% | 19% |
| 2012 | 24.04% | 27.41% |
| 2013 | 24.03% | 39.21% |
| 2014 | 23.95% | 53.65% |
| 2015 | 20.2% | 64.2% |
| 2016 | 19.29% | 69.11% |
| 2017 | 19.65% | 72.63% |
| 2018 | 20.47% | 75.45% |
| 2019 | 22.71% | 75.47% |
| 2020 | 26.28% | 73.06% |
| 2021 | 27.34% | 71.89% |
| 2022 | 27.85% | 71.47% |
| 2023 | 29.02% | 70.26% |
| 2024 | 27.81% | 71.56% |
| 2025 | 27.13% | 72.46% |
(Note: Data for 2025 is as of July.)
Also read about: iPhone Users Statistics
iPhone’s Stronghold in the US
While Android leads globally, the narrative flips when we look at the United States.
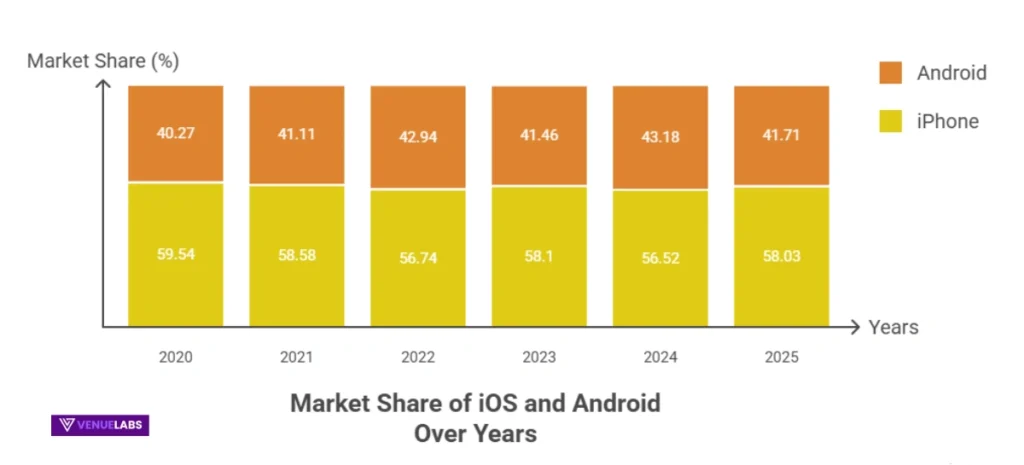
In 2025, the iPhone commands the mobile market in the US with a 58.03% market share, significantly outpacing Android phones, which hold 41.71%.
The iPhone has consistently led the US smartphone market since at least 2009, with its closest competitor in 2011 when Android gained traction by attracting former Blackberry users.
This US preference for iPhone highlights strong brand loyalty, perceived premium quality, and a deeply integrated ecosystem that resonates with American consumers.
Here is the recent data on iPhone/iOS vs. Android market share in the US since 2009:
| Year | iPhone (iOS) | Android |
| 2009 | 57.9% | 6.16% |
| 2010 | 38.31% | 18.71% |
| 2011 | 38.33% | 35.32% |
| 2012 | 49.48% | 40.63% |
| 2013 | 52.79% | 39.25% |
| 2014 | 52.3% | 42.58% |
| 2015 | 50.85% | 46.42% |
| 2016 | 53.19% | 45.2% |
| 2017 | 53.89% | 45.23% |
| 2018 | 54.82% | 44.73% |
| 2019 | 55.23% | 44.51% |
| 2020 | 59.54% | 40.27% |
| 2021 | 58.58% | 41.11% |
| 2022 | 56.74% | 42.94% |
| 2023 | 58.1% | 41.46% |
| 2024 | 56.52% | 43.18% |
| 2025 | 58.03% | 41.71% |
(Note: Data for 2025 is as of July.)
Also read about: Apple Statistics
How Many Users Are We Talking About?
As of 2022, an estimated 133.4 million individuals in the US own an Android smartphone, while the number of iPhone users in the US stands at 118.1 million.
These figures underscore the vast reach of both platforms, impacting nearly every aspect of digital communication and interaction in the country.
Smartphone Sales: Who Ships More Devices?
Looking at quarterly sales provides another perspective on the market dynamics.
In Q2 2025, Samsung, a leading Android manufacturer, shipped 58 million Android smartphones, securing a 19.7% market share of the worldwide smartphone market.
Apple, in the same quarter, delivered 46.4 million iOS devices, capturing a 15.7% share.
This indicates that while Apple’s devices often command higher prices and profitability per unit, the sheer volume of Android devices, propelled by numerous manufacturers and diverse price points, leads to higher overall unit shipments for the Android ecosystem.
In Q4 2023, Android smartphones accounted for 56% of quarterly worldwide smartphone sales, with iPhone capturing a 37% market share.
Sales in Key Countries: A Diverse Landscape
The global landscape shows varying preferences. In Q3 2024, Android’s market share in smartphone sales surpassed iPhone in all selected markets, reinforcing its global reach beyond the US.
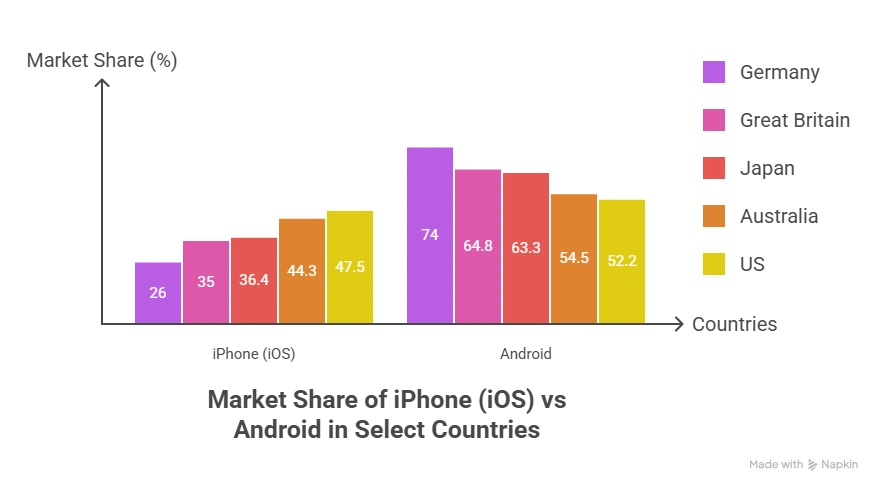
Here’s the latest data on iPhone and Android market share in 9 select markets:
| Country | iPhone (iOS) | Android |
| US | 47.5% | 52.2% |
| Australia | 44.3% | 54.5% |
| Japan | 36.4% | 63.3% |
| Great Britain | 35% | 64.8% |
| Germany | 26% | 74% |
| Italy | 25.1% | 74.3% |
| France | 22.9% | 76.7% |
| China | 20.9% | 65.1% |
| Spain | 18.3% | 81% |
It’s important to note the slight discrepancy in US market share between the first “iPhone vs Android Market Share in the US” table (58.03% iOS in 2025) and this table (47.5% iOS in Q3 2024).
This often arises from different data sources or timeframes for market share calculation, highlighting the dynamic nature of these statistics.
Outside of the US, iPhone also leads in countries like Japan (68.86%), Canada (60.31%), Australia (59.63%), and the United Kingdom (52.29%) as of 2024.
However, Android shows an even more impressive market share in other nations. For example, in India, Android’s market share is a staggering 95.16%.
Google’s OS also has a sharp edge in Brazil (81.45%), Mexico (77.46%), and China (74.76%) (data for 2024).
This geographic distribution shows that while Apple excels in affluent markets, Android’s accessibility and wider range of devices make it the preferred choice in many emerging economies.
Also read about: Android Statistics
The App Ecosystem: Quantity, Quality, and Cold Hard Cash
Smartphones are nothing without their apps, and both the Apple App Store and Google Play Store offer a universe of digital experiences. However, their characteristics, from the number of available apps to consumer spending, reveal interesting differences.
Number of Available Apps: A Close Race
In terms of sheer numbers, the Google Play Store for Android users slightly edges out the App Store.
Approximately 1.68 million apps are available in the Google Play Store, while around 1.55 million apps are currently available for iPhone users to download in the App Store (as of March 2025).
Both platforms see a high volume of new app releases, averaging around 1,200 new apps daily. Android also boasts more distinct app categories (49 vs. iPhone’s 26), offering a broader spectrum of specialized applications.
App Ratings: Where Android Shines
Android apps tend to enjoy higher user ratings on average.
This might be due to a combination of factors, including a more diverse user base with varying expectations, or simply different approaches to app development and user feedback mechanisms.
Here’s a breakdown of how apps are rated in the App Store and Google Play (as of March 2025):
| App Ratings | App Store Apps | Google Play Apps |
| 1.0-1.5 | 44,946 | 3,575 |
| 1.5-2.0 | 15,325 | 10,722 |
| 2.0-2.5 | 33,253 | 23,951 |
| 2.5-3.0 | 27,167 | 43,314 |
| 3.0-3.5 | 64,598 | 93,145 |
| 3.5-4.0 | 58,993 | 177,809 |
| 4.0-4.5 | 125,077 | 317,396 |
| 4.5-5.0 | 173,539 | 266,891 |
| 5.0 | 270,499 | 79,841 |
Also read about: Smartphone Usage Statistics
App Spending: iPhone Users Open Their Wallets More
Despite having fewer total users and apps, iPhone users consistently spend significantly more on mobile apps.
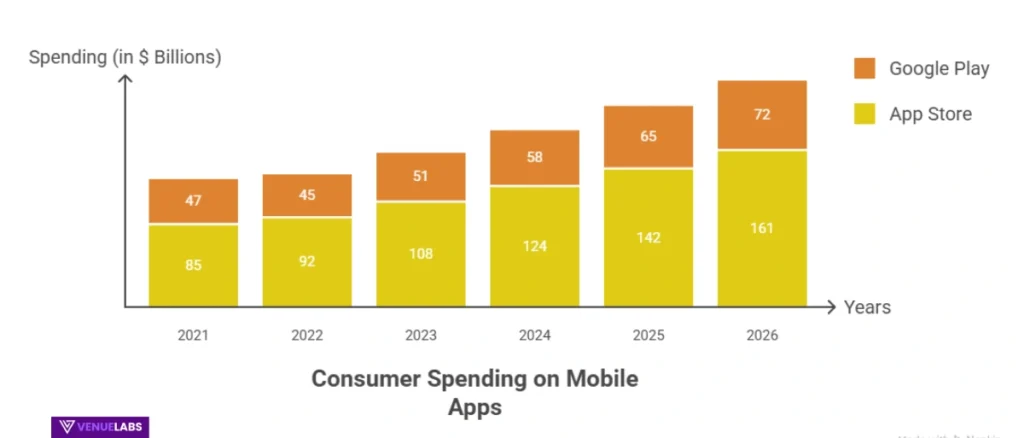
Consumer spending (including paid apps, in-app purchases, and subscriptions) on the App Store for iPhone users is forecasted to reach a staggering $142 billion in 2025.
In contrast, app spending on Google Play for Android users is projected at $65 billion in 2025.
This means iPhone users account for a dominant 68.6% of all consumer spending on mobile apps, while Android holds a 31.4% share worldwide in 2025.
This trend underscores a key difference in monetization potential for developers and a willingness to spend among Apple’s user base.
Here’s a detailed breakdown of consumer spending on mobile apps across the App Store and Google Play since 2021, including forecasts:
| Year | App Store (iPhone) Spending (in billions) | Google Play (Android) Spending (in billions) |
| 2021 | $85 | $47 |
| 2022 | $92 | $45 |
| 2023 | $108 | $51 |
| 2024 | $124 | $58 |
| 2025 | $142 | $65 |
| 2026 | $161 | $72 |
This disparity in spending can be attributed to several factors:
- Higher Disposable Income: iPhone users, on average, tend to have higher incomes.
- Perceived Value: Apple’s ecosystem often fosters a perception of premium quality, leading users to be more willing to pay for apps and in-app content.
- App Pricing Strategies: Developers may strategically price apps and in-app purchases higher on the App Store due to the higher spending propensity of iPhone users.
On average, an iPhone user spends $12.77 per app, compared to $6.19 for Android users. For in-app purchases, the average transaction on iPhones is $1.07, while on Android, it’s $0.43.
Best-Selling Smartphones: A Balanced Top 10
When it comes to the best-selling smartphone models, both ecosystems are well represented.
As of Q3 2024, Counterpoint Research indicates that 5 of the top 10 best-selling smartphones worldwide are iPhone models operating on iOS, with the other 5 being Samsung and Xiaomi smartphones running on the Android operating system.
This shows that both platforms offer highly desirable devices that resonate with consumers globally.
Here’s a complete list of best-selling smartphones by operating system (as of Q3 2024):
| Rank | Smartphone | Operating System |
| 1 | iPhone 16 | iOS |
| 2 | iPhone 16 Pro Max | iOS |
| 3 | iPhone 16 Pro | iOS |
| 4 | iPhone 15 | iOS |
| 5 | Galaxy A16 5G | Android |
| 6 | Galaxy A06 | Android |
| 7 | Galaxy S25 Ultra | Android |
| 8 | Redmi 14C 4G | Android |
| 9 | Galaxy A55 5G | Android |
| 10 | iPhone 16 Plus | iOS |
Also read about: Mobile Marketing Statistics
User Demographics and Loyalty: Unpacking the “Tribe”
Human nature often leads to tribalism, and smartphone choices are no exception. Surveys reveal interesting differences in demographics and fierce loyalty among iPhone and Android users.
Demographics: Income, Age, and Gender
- Income: iPhone users generally have higher incomes. Research shows iPhone users had an average annual salary of $53,251 compared to 37,040forAndroidusers(datafor2021).ThehigherstartingpriceofiPhones(799 for the latest model) versus the average Android smartphone price ($286) likely contributes to this disparity.
- Engagement: iPhone users tend to be more active with their smartphones. They average 4 hours and 54 minutes of screen time, send 58 text messages, and take 12 selfies daily. Android users show lower numbers: 3 hours and 42 minutes of screen time, 26 text messages, and 7 selfies per day.
- Security Confidence: iPhone users exhibit slightly more confidence in their smartphone’s security features. In a 2022 survey, 20% of iPhone users felt “extremely confident” that Apple iCloud Keychain keeps their data secure, compared to 13% of Android users feeling the same about Google Password Manager. However, Android users are more likely to use a native password manager (72% vs. 62%), while iPhone users are more likely to monitor location tracking in their apps (77% vs. 68%).
- Age: Younger generations in the US, specifically Gen Z and Millennials, are more likely to be iPhone users. Android holds a slight edge with older generations (55 and older). This trend holds globally, with Gen Z (31% iPhone, 57% Android) and Millennials (35% iPhone, 55% Android) showing a stronger inclination towards Apple.
- Gender: Globally, female users are slightly more likely to adopt iPhones than male users. 31% of female users are iPhone users, compared to 28% of male users (data for 2024).
Here’s a breakdown of iPhone vs Android users by age in the United States:
| Age | iPhone | Android |
| 18-34 | 58% | 41% |
| 35-54 | 47% | 53% |
| 55+ | 49% | 51% |
And worldwide:
| Age | iPhone | Android |
| Gen Z | 31% | 57% |
| Millennial | 35% | 55% |
| Gen X | 22% | 60% |
| Baby Boomer | 23% | 55% |
Loyalty: Switching Sides is Rare, but It Happens
Smartphone owners are incredibly loyal to their chosen operating system. Both Android and iPhone boast impressively high customer retention rates.
Android typically sees an 89-91% customer retention rate, while iPhone’s retention rate ranges from 85-88%. These numbers suggest that once users pick a side, they tend to stick with it for the long haul.
However, a fraction of users do switch. Interestingly, 18% of iPhone users are former Android users, whereas only 11% of Android users made the switch from Apple.
The primary reasons for switching platforms boil down to user experience and affordability:
- User Experience: A significant 47% of former Android users report that the iPhone provides a better user experience. In contrast, only 30% of former iPhone users say the same about Google’s OS.
- Affordability: Cost plays a crucial role for those moving to Android. 29% of former iPhone users switched to Android because it was more affordable. Only 11% of former Android users believed their new iPhone was more affordable.
Current Trends and What Users Are Asking
Beyond the core statistics, online communities like Quora and Reddit offer a pulse on emerging user concerns and interests regarding iPhone and Android. Here are some of the latest discussions:
- Interoperability and “Green Bubbles”: Users on Reddit frequently discuss the social implications of iMessage’s blue versus green bubbles, highlighting the perceived pressure, especially among younger demographics, to conform to iPhone use for seamless group chats. Many Android users express frustration over the lack of full cross-platform compatibility with features like reactions and higher-quality media sharing in messaging.
- AI Integration: With the rise of advanced AI, users are keenly observing how both Apple and Google integrate artificial intelligence into their devices. Questions revolve around on-device AI capabilities, privacy implications of AI processing, and how AI will enhance everyday tasks like photo editing, voice commands, and predictive features. Apple Intelligence, unveiled in 2024, is sparking considerable interest in this area.
- Battery Life and Charging Standards: The enduring quest for better battery life remains a hot topic. Users compare real-world battery performance across new iPhone and Android models. Additionally, the move towards USB-C as a universal charging standard, prompted by regulations in some regions, is frequently discussed, with users welcoming the convenience but also wondering about charging speeds and compatibility across devices.
- Foldable Phones and Innovative Form Factors: While Apple has yet to release a foldable device, Android manufacturers continue to innovate with various foldable and flip phone designs. Users on Quora often ask about the durability, practical benefits, and future potential of these new form factors, and whether Apple will eventually enter this segment.
- Camera Capabilities Beyond Megapixels: Beyond raw megapixel counts, discussions increasingly focus on computational photography, low-light performance, video capabilities (especially cinematic modes), and advanced zoom features. Users often share comparison photos and videos, seeking advice on which platform offers the best overall camera experience for their specific needs.
- Privacy Concerns: Both platforms constantly update their privacy features. Users engage in discussions about data collection practices, app permissions, VPN integration, and the overall security posture of iOS versus Android, especially in light of increasing digital threats.
These discussions reveal that users are not just looking at specifications; they are evaluating the entire user experience, social dynamics, and the future potential of their chosen platform.
FAQs About iPhone Vs Android Statistics
1. Which smartphone operating system is more popular globally in 2025?
As of July 2025, Android is significantly more popular globally, holding a 72.46% market share, while iPhone (iOS) captures 27.13% of the worldwide smartphone market.
2. Is iPhone or Android more popular in the United States in 2025?
In the United States, iPhone is more popular, leading the mobile market with a 58.03% market share, compared to 41.71% for Android phones as of July 2025.
3. Do iPhone users or Android users spend more money on apps?
iPhone users spend significantly more money on apps; in 2025, consumer spending on the App Store is forecasted to reach $142 billion, while spending on Google Play for Android users is projected to be $65 billion.
4. What are the key demographic differences between iPhone and Android users?
iPhone users generally have higher average incomes, tend to be younger (Gen Z and Millennials show a preference for iPhone), and are slightly more likely to be female globally, while Android users encompass a broader demographic and age range, often prioritizing affordability and device variety.
5. How does user loyalty compare between iPhone and Android?
Both iPhone and Android users demonstrate high loyalty, with Android having an 89-91% customer retention rate and iPhone an 85-88% retention rate; however, 18% of current iPhone users previously used Android, compared to 11% of Android users who switched from Apple.
Also Read:
- Gemini Statistics
- Videogame Industry Statistics
- Link Building Statistics
- Content Marketing Statistics
- Email Marketing Statistics
Conclusion: Making Your Choice
The iPhone vs. Android debate in 2025 is not about a single “winner” but rather about finding the best fit for your individual needs and preferences.
Android clearly dominates the global smartphone market in terms of sheer device volume and market share, driven by its affordability and diverse range of manufacturers.
However, iPhones maintain a strong lead in affluent markets like the US and consistently generate significantly more revenue from app spending, indicating a user base willing to invest more in their digital experience.
iPhone users often prioritize a seamless ecosystem, strong brand loyalty, and a perception of premium quality and user experience. They tend to have higher incomes and spend more on apps.
Android users, on the other hand, benefit from greater customization options, a wider range of device choices at various price points, and strong global market penetration.
As technology evolves, especially with advancements in AI, privacy features, and new form factors, both ecosystems will continue to innovate.
Whether Android maintains its global lead or iPhone expands its influence will depend on how each platform addresses evolving consumer demands for features, affordability, and a truly integrated digital life.
Your choice ultimately boils down to what you value most in your smartphone experience.
Source: Statista, Exploding Topics
