In 2025, screens are more than just devices; they are integral parts of our daily lives, connecting us to work, entertainment, education, and each other.
Understanding Average Screen Time statistics 2025 is crucial for individuals seeking to balance their digital habits and for businesses aiming to engage audiences effectively.
This detailed article explores the latest data on screen usage across various demographics, activities, and regions, offering insights into how our digital behaviors are evolving and what that means for our well-being and productivity.
From smartphones in our pockets to massive televisions in our living rooms, screens permeate nearly every aspect of modern existence.
The ongoing evolution of technology and content means our screen habits are constantly shifting. Let’s delve into the numbers that define our relationship with screens in 2025.
The Digital Immersion: A Global Snapshot of Screen Time
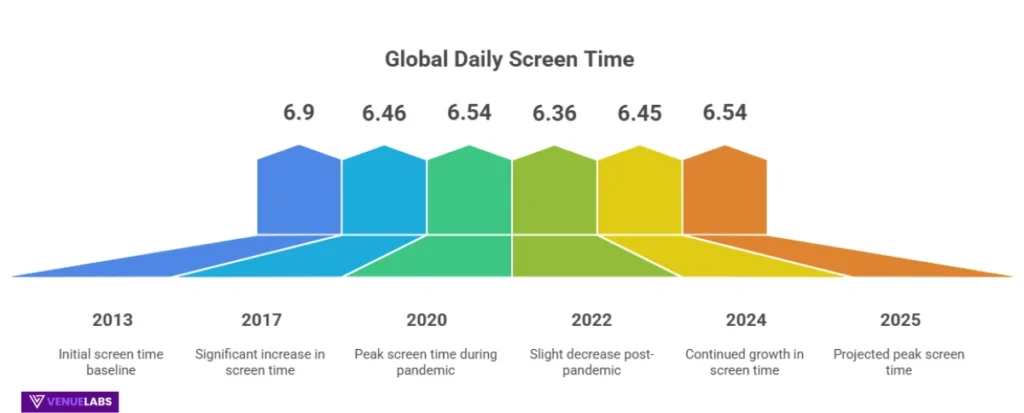
Our digital immersion continues to deepen. On average, people worldwide now spend an astonishing 6 hours and 45 minutes daily on screens.
This equates to over 47 hours and 15 minutes per week, or roughly 40% of our waking hours.
This figure is projected to reach 6 hours and 54 minutes by the end of Q3 2025, marking a consistent upward trend since 2013, despite a slight decrease in adult screen time since 2021.
This global average, however, masks significant regional and demographic variations.
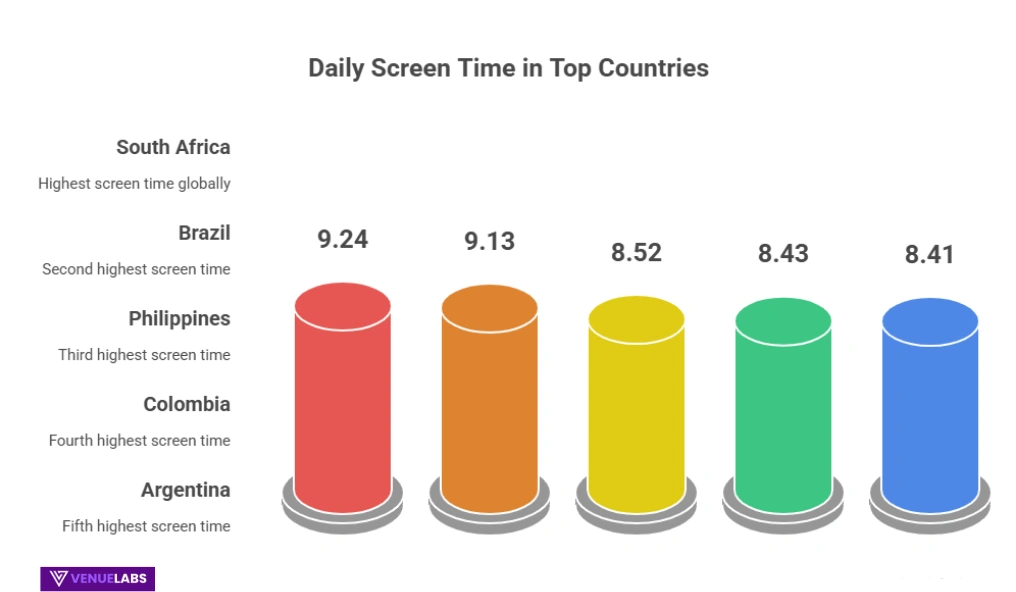
In countries like South Africa, daily screen time soars to an average of 9 hours and 24 minutes, demonstrating stark differences in digital engagement across the globe.
Top Picks: Key Average Screen Time Statistics
Here are some of the most compelling Average Screen Time statistics 2025 that highlight current trends:
- Global Average: People worldwide spend approximately 6 hours and 45 minutes on screens every day.
- US Average: The average US adult screen time has reached 7 hours and 2 minutes.
- Teenager Engagement: A significant 41% of teenagers spend over 8 hours on screens daily.
- Highest National Screen Time: South Africans lead globally, averaging 9 hours and 24 minutes on screens each day.
- Social Media Focus: The average person dedicates 2 hours and 31 minutes daily to social media platforms.
- Gen Z’s Digital Life: The average Gen Z individual spends around 9 hours per day on screens.
- Frequent Phone Checks: An average American checks their phone a staggering 96 times every day.
These statistics paint a vivid picture of our intense reliance on and interaction with digital interfaces.
Also read about: Android Statistics
Average Screen Time Overview: A Decade of Digital Growth
The journey of average screen time over the past decade reveals a consistent pattern of increased digital engagement.
Average Screen Time Statistics (Q3 2013 – Q3 2025 Projected)
| Date | Average Screen Time | Annual Change |
| Q3 2013 | 6 hours 9 minutes | N/A |
| Q3 2014 | 6 hours 23 minutes | +3.7% |
| Q3 2015 | 6 hours 20 minutes | -0.8% |
| Q3 2016 | 6 hours 29 minutes | +2.6% |
| Q3 2017 | 6 hours 46 minutes | +4.3% |
| Q3 2018 | 6 hours 48 minutes | +0.4% |
| Q3 2019 | 6 hours 38 minutes | -2.4% |
| Q3 2020 | 6 hours 54 minutes | +4.2% |
| Q3 2021 | 6 hours 58 minutes | +0.8% |
| Q3 2022 | 6 hours 36 minutes | -5.1% |
| Q3 2023 | 6 hours 40 minutes | N/A |
| Q3 2024 | 6 hours 45 minutes | +1.25% |
| *Q3 2025 | 6 hours 54 minutes | +2.22% |
While we observe some fluctuations, the overall trend clearly points towards an increasing amount of time spent engaging with screens.
This growth highlights the pervasive nature of digital technology in our lives.
Also read about: iPhone vs. Android Statistics
US Average Screen Time: A Deep Dive into American Habits
Adults in the United States spend approximately 7 hours and 2 minutes per day on screens, which is slightly above the global average.
This figure has remained relatively stable since 2021, suggesting a plateau after pandemic-related surges.
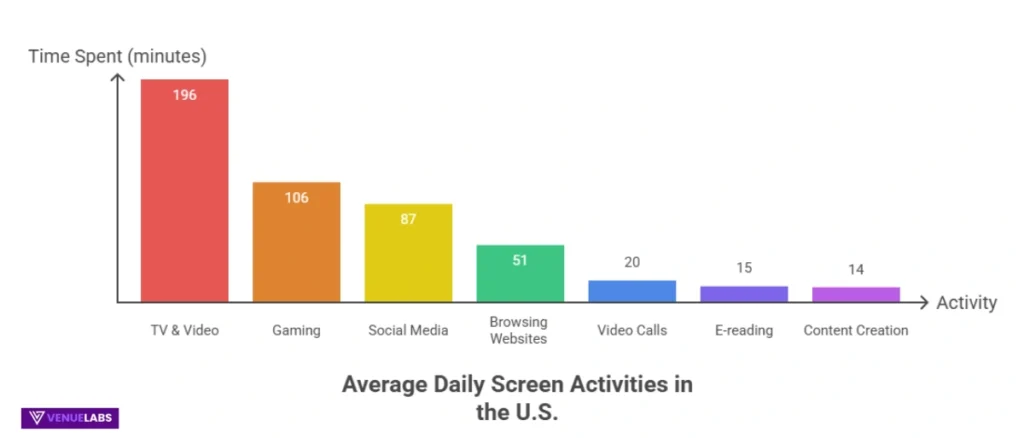
US adults allocate their screen time across various activities, with passive consumption like TV and video leading the way.
Breakdown of Average Daily Screen Time for US Adults
| Activity | Average Daily Screen Time |
| Watching TV/Videos | 3 hours 16 mins |
| Gaming | 1 hour 46 mins |
| Social Media | 1 hour 27 mins |
| Browsing Websites | 51 mins |
| Other | 29 mins |
| Video Chatting | 20 mins |
| E-reading | 15 mins |
| Content Creation | 14 mins |
Interestingly, while the US is a major technology consumer, it slightly trails the global average in the proportion of the population streaming TV and playing video games.
However, US adults spend 15 minutes more than the global average on video games, but 13 minutes less on social media.
Screen Time by Age and Generation: A Youth-Driven Digital World
Age plays a significant role in determining screen time consumption. Younger generations are unequivocally leading the charge in digital engagement.
- Gen Z (13-28 years old) spends the most time on screens, averaging over 9 hours every day. This is approximately 2 hours more than the US and global average.
- Millennials follow, with an average of 6 hours and 42 minutes.
- Gen X dedicates 4 hours and 10 minutes.
- Baby Boomers spend the least, at 3 hours and 31 minutes.
Average Screen Time by Generation
| Generation | Average Screen Time |
| Gen Z | 9 hours |
| Millennials | 6 hours 42 minutes |
| Gen X | 4 hours 10 minutes |
| Baby Boomers | 3 hours 31 minutes |
When we break it down by age group and gender, female internet users aged 16 to 24 and male users aged 25 to 34 spend the most time on screens. Conversely, individuals aged 55 to 64 spend the least.
Average Screen Time by Age Group and Gender
| Age Group | Female (Hours & Minutes) | Male (Hours & Minutes) |
| 16-24 | 7 hours 32 minutes | 7 hours 7 minutes |
| 25-34 | 7 hours 3 minutes | 7 hours 13 minutes |
| 35-44 | 6 hours 25 minutes | 6 hours 40 minutes |
| 45-54 | 6 hours 9 minutes | 6 hours 5 minutes |
| 55-64 | 5 hours 17 minutes | 5 hours 14 minutes |
Also read about: iPhone vs. Android Statistics
Global Internet Usage: Where the World Spends Its Time Online
Screen time is predominantly spent on internet-connected activities. Globally, as of 2025, the average time spent online mirrors the overall screen time at 6 hours and 45 minutes.
However, there are significant disparities across countries.
Countries with the Most Screen Time (2025)
| S.No. | Country | Average Screen Time (Hours & Minutes) |
| 1 | South Africa | 9 hours 24 minutes |
| 2 | Brazil | 9 hours 13 minutes |
| 3 | Philippines | 8 hours 52 minutes |
| 4 | Colombia | 8 hours 43 minutes |
| 5 | Argentina | 8 hours 41 minutes |
| 6 | Chile | 8 hours 31 minutes |
| 7 | Russia | 8 hours 21 minutes |
| 8 | Malaysia | 8 hours 17 minutes |
| 9 | U.A.E. | 8 hours 11 minutes |
| 10 | Thailand | 7 hours 58 minutes |
| 11 | Egypt | 7 hours 55 minutes |
| 12 | Indonesia | 7 hours 38 minutes |
| 13 | Mexico | 7 hours 37 minutes |
| 14 | Portugal | 7 hours 30 minutes |
| 15 | Bulgaria | 7 hours 29 minutes |
| 16 | Israel | 7 hours 20 minutes |
| 17 | Taiwan | 7 hours 13 minutes |
| 18 | Saudi Arabia | 7 hours 9 minutes |
| 19 | U.S.A. | 7 hours 3 minutes |
| 20 | Turkey | 6 hours 57 minutes |
This table shows a strong presence of South American, Southeast Asian, and Middle Eastern countries among the highest screen time users, often significantly exceeding the global average.
Devices and Platforms: The Tools of Our Digital Lives
Smartphones are indeed the “invention of the century” when it comes to screen time, fundamentally reshaping how we interact with the digital world.
With over 6.8 billion smartphone users globally, these devices are major contributors to increased screen time.
Mobile Screen Time
Globally, smartphones account for 53% of total screen time. As of 2025, the global average time spent on mobile devices is 4 hours and 37 minutes.
Average Mobile Screen Time in Selected Countries (2025)
| S.No. | Country | Average Time Spent on Smartphone (Hours & Minutes) |
| 1 | Ghana | 5 hours 43 minutes |
| 2 | Philippines | 5 hours 21 minutes |
| 3 | Brazil | 5 hours 12 minutes |
| 4 | South Africa | 5 hours 11 minutes |
| 5 | Thailand | 5 hours |
| 6 | Chile | 4 hours 58 minutes |
| 7 | Kenya | 4 hours 57 minutes |
| 8 | Colombia | 4 hours 47 minutes |
| 9 | Malaysia | 4 hours 42 minutes |
| 10 | Argentina | 4 hours 40 minutes |
Desktop Screen Time
While mobile dominates, computers still contribute significantly. The total share of computer screen time is 47%, with the global average time spent on computer screens being 3 hours and 14 minutes as of 2023.
Average Desktop Screen Time in Selected Countries
| Country | Screen Time On Desktops (Hours & Minutes) |
| South Africa | 5 hours 37 minutes |
| Brazil | 4 hours 54 minutes |
| Colombia | 4 hours 54 minutes |
| Philippines | 4 hours 40 minutes |
| Thailand | 4 hours 38 minutes |
| Argentina | 4 hours 34 minutes |
| Portugal | 4 hours 22 minutes |
| Malaysia | 4 hours 21 minutes |
| Mexico | 4 hours 18 minutes |
| Russia | 4 hours 11 minutes |
Streaming Services Screen Time
Streaming has become a cornerstone of entertainment. In the United States, people spend significant time on platforms like Hulu, Netflix, Amazon Prime, and Disney+.
Average Streaming Time on Top Platforms (US)
| Platform | Streaming Time (Hours & Minutes) |
| Hulu | 2 hours 10 minutes |
| Netflix | 1 hour 50 minutes |
| Amazon Prime | 1 hour 37 minutes |
| Disney+ | 1 hour 29 minutes |
Social Media Screen Time: The Heart of Digital Connection
Social media platforms are colossal time sinks, capturing a significant portion of our daily screen time. Globally, people spend an average of 2 hours and 31 minutes per day on social media. This figure has steadily increased over the past decade.
Daily Time Spent on Social Media by Users Globally (2012-2025)
| Year | Daily Time Spent On Social Media (Hours & Minutes) |
| 2012 | 1 hour 30 minutes |
| 2013 | 1 hour 35 minutes |
| 2014 | 1 hour 44 minutes |
| 2015 | 1 hour 51 minutes |
| 2016 | 2 hours 8 minutes |
| 2017 | 2 hours 14 minutes |
| 2018 | 2 hours 22 minutes |
| 2019 | 2 hours 25 minutes |
| 2020 | 2 hours 25 minutes |
| 2021 | 2 hours 25 minutes |
| 2022 | 2 hours 27 minutes |
| 2023 | 2 hours 31 minutes |
| 2024 | 2 hours 27 minutes |
| 2025 | 2 hours 31 minutes |
TikTok has emerged as a dominant force, with users spending an average of 1.5 hours per day on the platform, making it the leading social media app for time spent.
Children and Screen Time: A Growing Concern
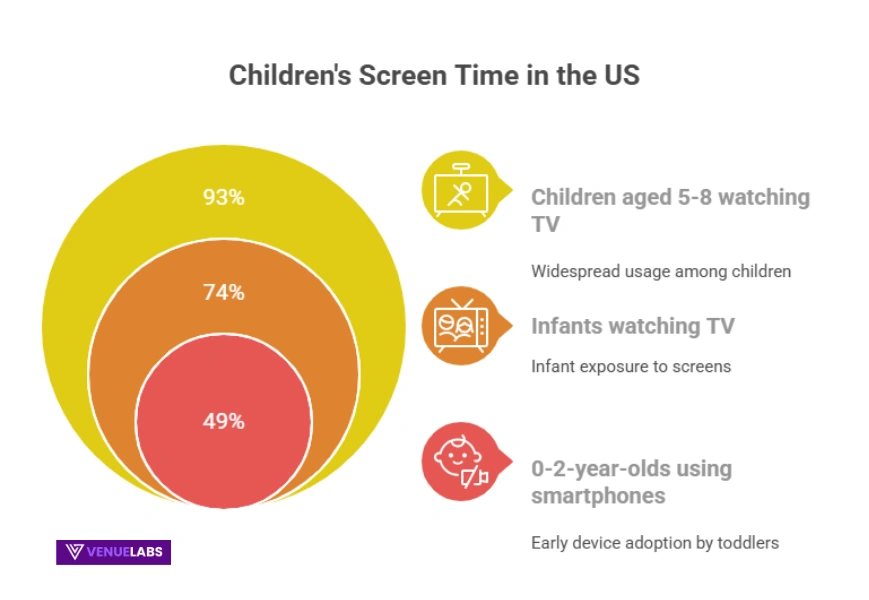
Children born into our tech-savvy world are exposed to screens from a very young age, raising concerns among parents and educators.
- Infant Exposure: 74% of American parents report that their two-year-old child watches TV.
- Widespread Usage: 93% of children aged 5 to 8 years old watch TV.
- Early Device Adoption: Almost half (49%) of 0-2-year-olds interact with smartphones, highlighting pervasive early exposure.
- Teenage Habits: US teenagers spend over 3 hours per day watching TV or videos, with social media taking up 1 hour and 27 minutes.
Time Spent by Children on Leading Social Media Apps (US)
| Leading Social Media Apps | Time Spent On App By Children (Hours & Minutes) |
| TikTok | 1 hour 53 minutes |
| Snapchat | 1 hour 30 minutes |
| 20 minutes | |
| 18 minutes | |
| 13 minutes | |
| 10 minutes |
Parental involvement in managing screen time is evident, with 60% of US parents limiting their children’s screen time. However, 40% of parents do not impose any limits, indicating diverse approaches to this challenge.
The Impact of Screen Time on Health: A Double-Edged Sword
Numerous studies underscore a critical correlation between screen time and various health aspects, encompassing both physical and mental well-being.
- Recommended Limits: The general recommended daily screen time for adults is 2 hours, with children under two years old advised to have no screen time at all. Disturbingly, 87% of children exceed the recommended screen time.
- Behavioral Influence: 32% of users reported that their behavior was influenced by screen time, indicating a notable psychological impact.
- Physical Health Risks: Excessive screen time is strongly linked to a sedentary lifestyle, which increases the risk of obesity (23%), Type 2 diabetes (15%), heart disease (12%), and stroke (10%).
- Mental Health Concerns: Screen time can interfere with sleep due to blue light suppressing melatonin production. It is also associated with mental health issues like depression (6%) and anxiety (5%), and can contribute to social isolation and cyberbullying. Limiting social media use to 30 minutes daily has been linked with reduced depression and improved well-being.
Diseases Most Associated with Excessive Screen Time
| Disease | Share Of Disease Caused By Excessive Screen Time |
| Obesity | 23% |
| Type 2 diabetes | 15% |
| Heart disease | 12% |
| Stroke | 10% |
| Cancer | 7% |
| Depression | 6% |
| Anxiety | 5% |
| Cyberbullying | 3% |
| Social isolation | 2% |
How You Can Benefit from Understanding Screen Time Statistics in 2026
For individuals and businesses, comprehending these statistics offers powerful advantages:
For Individuals:
- Mindful Digital Habits: Recognize your own screen time patterns. Use built-in device features (like Apple’s Screen Time or Digital Wellbeing on Android) to monitor usage and set healthy limits.
- Optimize Productivity: Understand when and how you use screens productively versus unproductively. Shift passive consumption (like endless scrolling) towards activities like e-reading or content creation, which have lower average usage times.
- Prioritize Well-being: Be aware of the health risks associated with excessive screen time. Take regular breaks, ensure physical activity, and reduce blue light exposure before sleep to mitigate negative impacts.
- Support Children’s Health: If you are a parent, use these statistics to inform your approach to children’s screen time, setting appropriate limits and encouraging diverse activities.
- Identify Digital Hotspots: If you’re struggling with excessive usage, identify which activities (social media, gaming) consume the most time and develop strategies to reduce them.
For Businesses and Marketers:
- Platform Prioritization: Understand where your target audience spends their screen time (mobile vs. desktop, specific social media platforms) to optimize your advertising and content distribution.
- Content Strategy: Tailor content to fit typical screen time allocations. For instance, short-form, engaging video for mobile social media; longer-form content for desktop users.
- Demographic Targeting: Leverage age and generational screen time data to refine your marketing campaigns. Gen Z requires mobile-first, highly visual, and interactive content.
- Health-Conscious Messaging: For health and wellness brands, integrate messaging around balanced screen time and digital well-being into your campaigns, aligning with growing consumer concerns.
- Mobile Optimization: With mobile dominating, ensure your websites, apps, and ads are fully responsive and provide a seamless user experience on smartphones.
- Ethical Design: As conversations around screen time’s impact grow, consider ethical design principles that promote healthy digital habits rather than endless engagement.
The Latest Buzz on Average Screen Time (Reddit & Quora)
Beyond the raw numbers, online communities shed light on the deeper anxieties, curiosities, and solutions users are seeking regarding screen time in 2025.
- “Is ‘Digital Detox’ Still Effective, or Just a Temporary Fix?”: Many users are questioning the long-term effectiveness of occasional “digital detoxes.” They wonder if it’s a sustainable solution or if it just creates a rebound effect, leading to even more screen time after the detox. The discussion centers on developing permanent healthy habits.
- “How Does Screen Time Affect Focus and Attention Spans in the AI Era?”: With AI constantly generating new content and notifications, users are concerned about its impact on their ability to concentrate. They are asking how constant digital stimulation and the “always-on” nature of AI tools might be shortening attention spans.
- “Are There Healthy Ways to Use Screens for Connection, Not Just Consumption?”: There’s a strong desire to differentiate between passive screen consumption (scrolling) and active, meaningful screen use (video calls with family, online learning, collaborative work). Users are asking for strategies to shift their screen time towards more enriching and connecting activities.
- “What Tech Solutions Can Ironically, users are looking for technological solutions – apps, settings, smart devices – that can help them curb their screen usage. This includes better parental controls, app timers, “grayscale” modes, and even AI-driven nudges to take breaks.
- “Beyond the ‘Blame Game,’ What Are Governments and Schools Doing?”: Moving beyond individual responsibility, users are asking about systemic approaches. What policies are governments implementing? How are schools integrating technology responsibly and teaching digital literacy without increasing overall screen time?
- “Is My Screen Time Actually Productive or Just a Distraction?”: This introspective question is common, especially among adults. Users want metrics or frameworks to genuinely assess if their time online is contributing to their goals or just serving as a sophisticated form of procrastination.
These discussions highlight a collective awareness and a proactive search for solutions to manage the pervasive nature of screens, reflecting a growing desire for balance and well-being in our hyper-connected lives.
FAQs About Screen Time Statistics
1. What is the global average screen time for individuals in 2025?
In 2025, the global average screen time for individuals is approximately 6 hours and 45 minutes per day, which represents a slight increase from previous years and accounts for a significant portion of waking hours.
2. Which age group spends the most time on screens according to 2025 statistics?
Gen Z, aged between 13 and 28 years old, consistently spends the most time on screens in 2025, averaging around 9 hours per day across various digital activities.
3. What are the primary health risks associated with excessive screen time?
Excessive screen time is linked to several health risks, including increased rates of obesity, Type 2 diabetes, heart disease, sleep deprivation due to blue light exposure, and mental health issues such as depression and anxiety.
4. How much time do people typically spend on social media daily in 2025?
As of 2025, the average person spends about 2 hours and 31 minutes per day on social media platforms, with video-centric apps like TikTok consuming a significant portion of this time.
5. Are there effective strategies to manage and reduce daily screen time?
Yes, effective strategies include using built-in device screen time monitors, setting daily limits for apps and overall usage, taking regular digital detox breaks, engaging in physical activities, and practicing mindful consumption by prioritizing productive screen activities over passive scrolling.
Also Read:
- Artificial Intelligence Statistics
- Gemini Statistics
- Shopify Statistics
- Metaverse Statistics
- Live Streaming Statistics
Conclusion
The Average Screen Time statistics 2025 confirm that we live in an era of unprecedented digital immersion.
While screens offer immense opportunities for connection, learning, and entertainment, they also present significant challenges to our physical and mental well-being.
Understanding these statistics is the first step towards fostering healthier digital habits for individuals and creating more responsible and engaging digital experiences for businesses.
As technology continues its relentless march forward, our ability to critically evaluate and manage our screen time will become an increasingly vital skill.
Source: Exploding Topics, Statista
