As we enter 2026, US immigration shapes population growth, economy, and policy debates.
With 51 million+ foreign-born residents (15% of population), America leads globally in immigrant numbers.
Yet, under tighter enforcement, growth slows for the first time in 50 years. This crisp analysis covers core data, visuals, impacts, and future insights.
US Immigration Statistics: Current Landscape
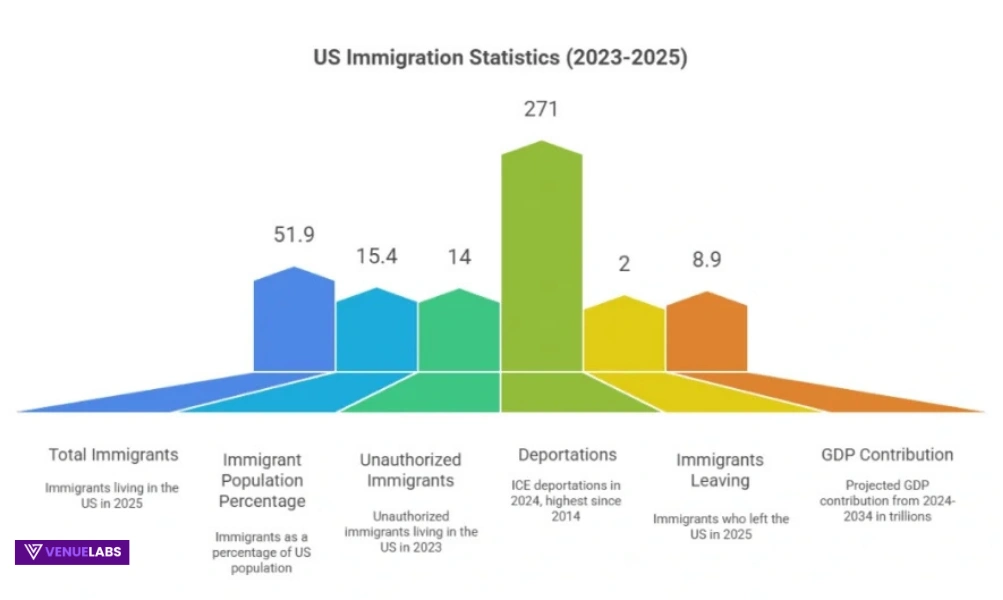
Mid-2025: 51.9M immigrants (15.4% of US population), down from early 2025’s 53.3M (15.8%) due to deportations and departures.
| Time | Population | Share |
| Mid-2025 | 51.9M | 15.4% |
| Early 2025 | 53.3M | 15.8% |
| 2023 | 47.8M | 14.1% |
| 2020 | 45.0M | 13.7% |
Also read about: Average US Salary and Household Income in 2026
Historical Growth
Since 1850, immigrant numbers surged 2,000% from 2.2M. Peaks in early 1900s; modern rise post-1965 Act.
| Year | Population | Share |
| 1850 | 2.2M | 9.7% |
| 1900 | 10.3M | 13.6% |
| 1950 | 10.3M | 6.9% |
| 1980 | 14.1M | 6.2% |
| 2000 | 31.1M | 11.1% |
| 2010 | 39.9M | 12.9% |
| 2020 | 45.0M | 13.7% |
| 2023 | 47.8M | 14.1% |
| 2025 | 51.9M | 15.4% |
Global Standing
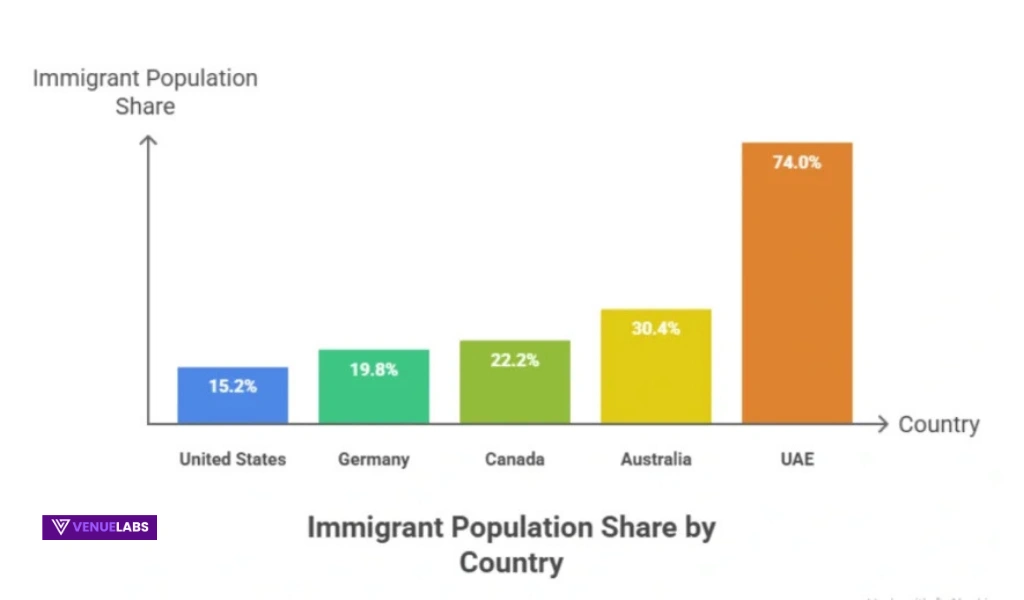
US has most immigrants (51.9M), but lower share than peers.
| Country | Share |
| UAE | 74.0% |
| Australia | 30.4% |
| Canada | 22.2% |
| Germany | 19.8% |
| US | 15.2% |
| UK | 14.3% |
| France | 13.2% |
Legal Status
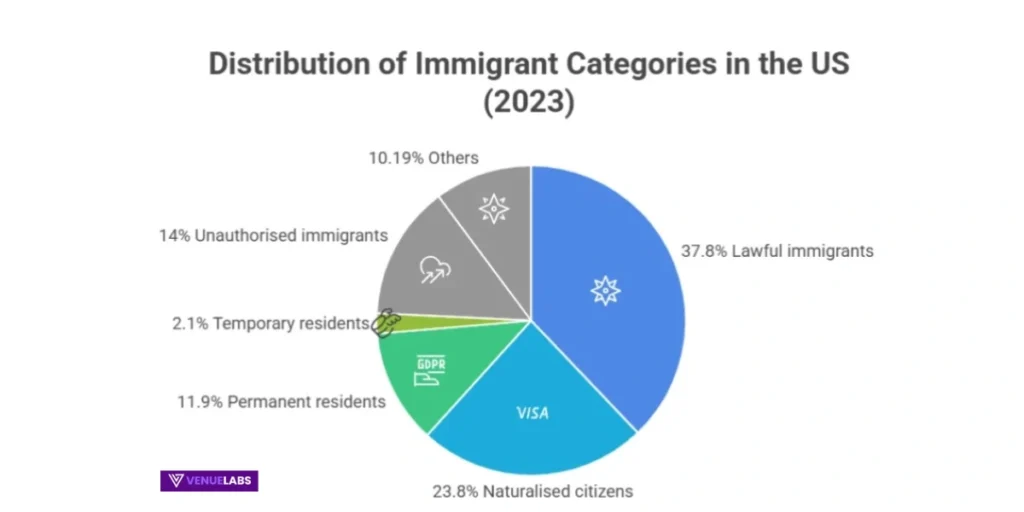
73% lawful; 27% unauthorized (14M in 2023, peak ever).
| Category | Population | Share of Foreign-Born |
| Naturalized | 23.8M | 46% |
| Permanent Residents | 11.9M | 23% |
| Temporary | 2.1M | 4% |
| Unauthorized | 14M | 27% |
Enforcement Surge
ICE deported 271K in FY2024 (highest since 2014). 2025: 2M+ left (1.6M voluntary, 527K deported). Detention: ~46K average.
| Administration | Actions (M) |
| Clinton | 12.2 |
| G.W. Bush | 10.3 |
| Obama | 5.3 |
| Trump (1st) | 1.5 |
| Biden | 0.271 |
Demographics
77% working-age (16-64), vs. 61% US-born.
| Age | Foreign-Born | US-Born |
| 0-15 | 4.9% | 21.4% |
| 16-64 | 77.1% | 60.9% |
| 65+ | 18.0% | 17.7% |
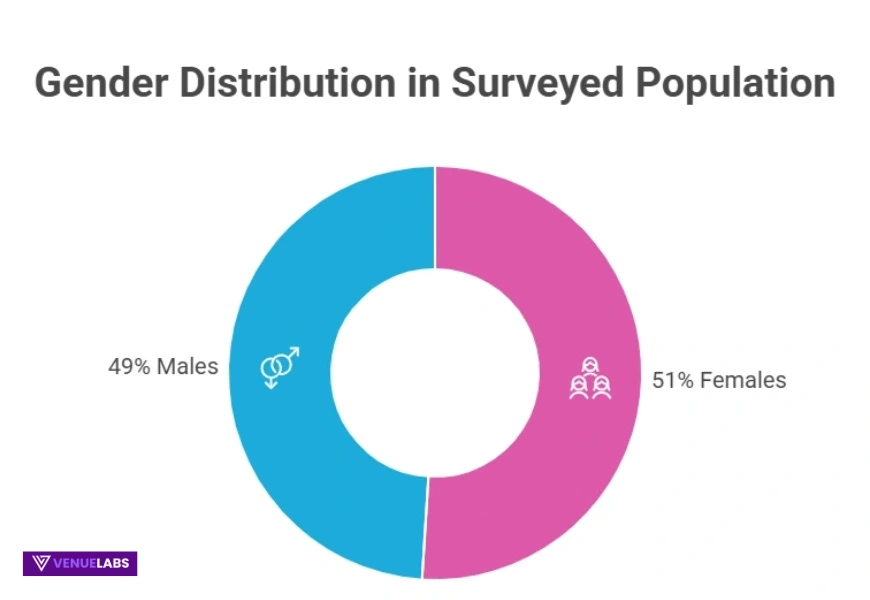
Gender: 51% female. Origins: Mexico leads (22.8%), but Asia rises.
| Country | Share |
| Mexico | 22.8% |
| India | 6.1% |
| China | 4.6% |
| Philippines | 4.3% |
| El Salvador | 3.1% |
| Others | 59.1% |
Economic Impact
Adds $8.9T to GDP (2024-2034), $1.2T revenue. Risks from restrictions: -6.8M workforce by 2028, -15.7M by 2035; GDP loss $1.9T by 2028, $12.1T by 2035.
| Horizon | Workforce Loss | GDP Loss |
| 2028 | -6.8M | -$1.9T |
| 2035 | -15.7M | -$12.1T |
Sectors: 18%+ in healthcare/tech; 25% construction; 70% agriculture.
Remote work (27.5% in 2025): Enables dispersion, rural talent attraction.
FAQs About US Immigration Statistics
1. How many immigrants live in the US in 2026?
As of mid-2025, the US has 51.9 million immigrants, making up 15.4% of the total population. This is a slight decrease from the earlier 2025 peak of 53.3 million.
2. What is the global rank of the US in terms of immigrant population?
The US has the highest number of immigrants globally, with 51.9 million foreign-born residents, but its share is lower than other countries like the UAE (74%), Australia (30.4%), and Canada (22.2%).
3. What percentage of immigrants in the US are unauthorized?
In 2023, 27% of the foreign-born population in the US, or about 14 million people, were unauthorized immigrants.
4. How does immigration impact the US economy?
Immigration is projected to add $8.9 trillion to the US GDP from 2024 to 2034, contributing $1.2 trillion in federal revenue. However, restrictive policies could lead to a workforce loss of 6.8 million by 2028, and a $12.1 trillion GDP loss by 2035.
Also Read:
- WhatsApp Statistics
- iPhone Users Statistics
- Instagram Statistics
- Google Searches Statistics
- Email Marketing Statistics
Conclusion:
- Slower growth amid enforcement.
- Skilled migration competition from Canada/Australia.
- Higher naturalization, political influence.
- Dispersion to South/Midwest.
- Regional: CA/TX/FL/NY host 50%; emerging: GA/NC.
Integration: Strong mobility, English acquisition; challenges in services.
Challenges: Wage effects on low-skill natives; fiscal strains locally; security concerns.
US immigration: Economic boon vs. policy tensions. 2026 choices define future growth, debt, and identity.
Source: Wikipedia, American Immigration Council
