
Amazon leads the world in e-commerce and cloud computing in 2025. The company generates massive revenue, serves millions of users, and shapes global shopping habits.
If you want to learn more about Amazon statistics 2025, this article dives deep into the data. We cover sales, market share, user behavior, and more.
Readers like you—whether buyers, sellers, or investors—can use these insights to make smarter decisions. For example, sellers learn how to boost profits, while buyers discover ways to save money.
We also include fresh details from user discussions on Quora and Reddit, where people share real experiences about Amazon’s ecosystem.
Amazon dominates with a 37.6% share of the U.S. e-commerce market. The company earns $167.7 billion in net revenue for Q2 2025 alone. Over 250 million people subscribe to Amazon Prime, enjoying fast shipping and exclusive deals.
Amazon processes 20 orders every second and ships more than 1.6 million packages daily. AWS, Amazon’s cloud service, grows fastest at 17.5% year-over-year. These Amazon statistics 2025 show a company that keeps innovating.
Amazon Statistics 2026 at a Glance
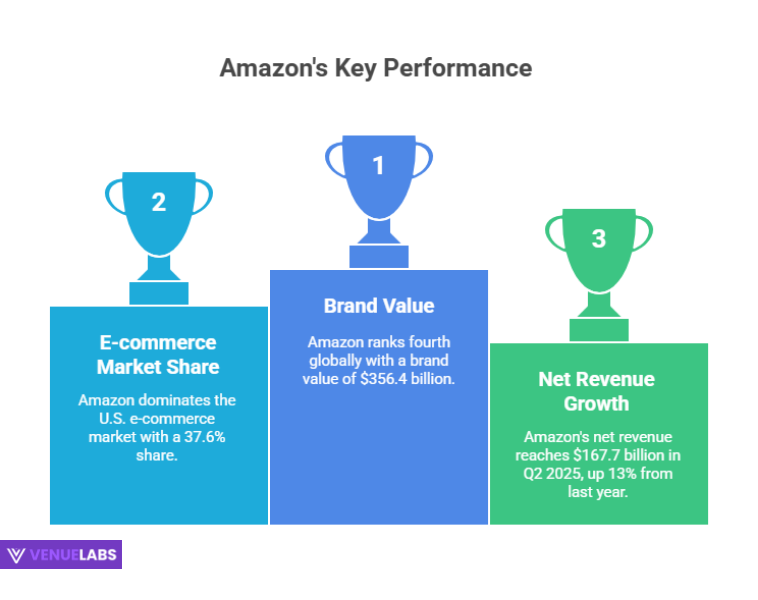
Amazon ranks as the fourth most valuable brand worldwide, valued at $356.4 billion. The platform holds 37.6% of the U.S. e-commerce market.
In Q2 2025, Amazon hits $167.7 billion in net revenue, up 13% from last year. Experts project Amazon’s ad revenue to reach $94 billion by 2026. AWS earns $30.9 billion in Q2 2025.
Prime membership surpasses 250 million users. The website attracts 2.56 billion visits globally. These quick facts highlight Amazon’s strength in 2025.
You can benefit from these stats. As a buyer, join Prime for perks like free shipping. Sellers tap into the huge audience to grow businesses. Investors note the steady growth for potential stock gains.
Amazon Market Share in 2026
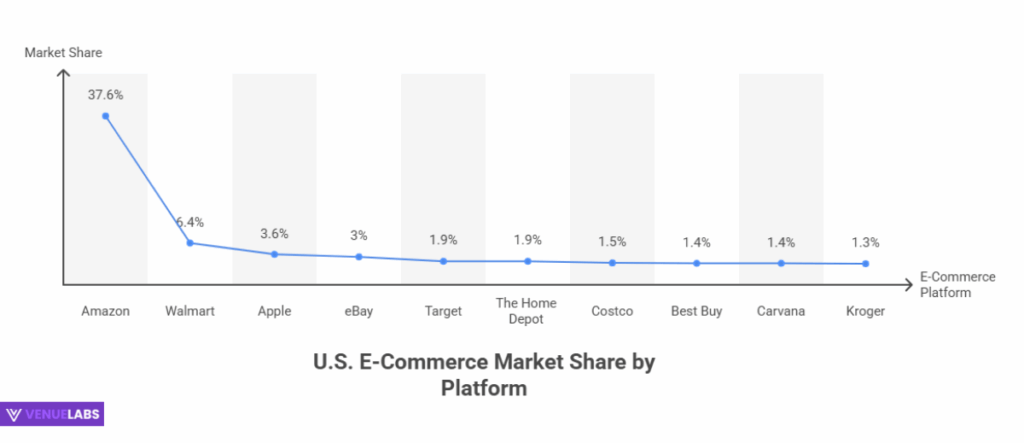
Amazon commands 37.6% of the U.S. e-commerce market, far ahead of competitors. Walmart holds just 6.4%, and Apple has 3.6%. This dominance means Amazon influences pricing and trends across online shopping.
In global terms, Amazon leads as the largest e-commerce retailer, outpacing JD.com by 22.3% in revenue.
Here is a table showing the market share of top e-commerce platforms in the United States:
| E-Commerce Platform | Percentage of Market Share |
| Amazon | 37.6% |
| Walmart | 6.4% |
| Apple | 3.6% |
| eBay | 3% |
| Target | 1.9% |
| The Home Depot | 1.9% |
| Costco | 1.5% |
| Best Buy | 1.4% |
| Carvana | 1.4% |
| Kroger | 1.3% |
Source: Statista
These numbers come from reliable sources and show Amazon’s lead. As a user, you benefit by shopping on Amazon for the widest selection and competitive prices. Sellers gain from the platform’s massive traffic, which drives more sales.
- Also read about: Best Surveys For Amazon Gift Cards 2025
Amazon Brand Value and Global Ranking
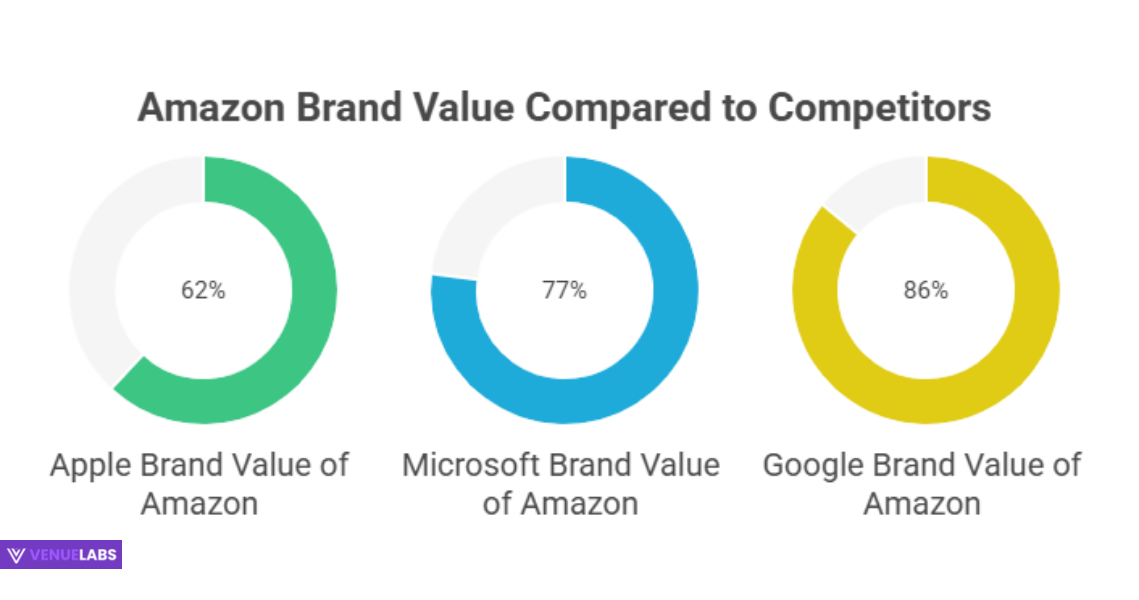
Amazon stands as the fourth most valuable brand in the world at $356.4 billion. Apple tops the list at $574.5 billion, followed by Microsoft and Google. This high value reflects Amazon’s trust and innovation.
Here is a table breaking down the most valuable brands compared to Amazon:
| Characteristic | Brand Value (in Billion USD) |
| Apple | 574.5 |
| Microsoft | 461.1 |
| 413.0 | |
| Amazon | 356.4 |
| Walmart | 137.2 |
| Samsung Group | 110.6 |
| TikTok/Douyin | 105.8 |
| 91.5 | |
| Nvidia | 87.9 |
| State Grid Corporation of China | 85.6 |
Buyers trust Amazon for quality, which means reliable purchases. Sellers leverage the brand’s reputation to build credibility.
Amazon Revenue Statistics 2026
Amazon generates impressive revenue. In Q2 2025, net sales reach $167.7 billion, a 13% increase from Q2 2024’s $148 billion. The trailing twelve months hit $670 billion, up 11%. Excluding foreign exchange, growth stands at 12%.
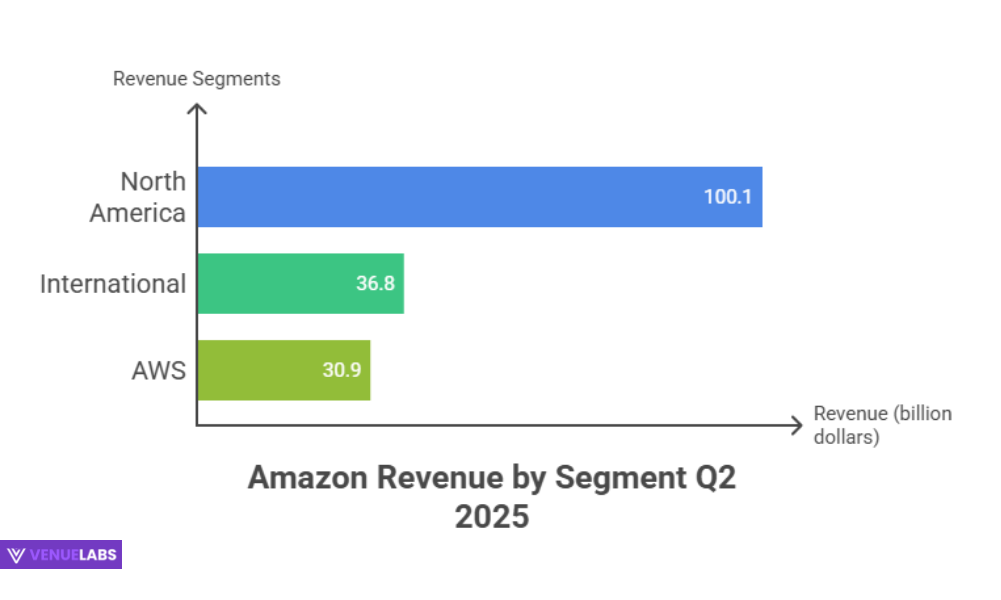
The North America segment contributes the most at 60% of total revenue, earning $100.1 billion in Q2 2025. International sales add $36.8 billion, and AWS brings in $30.9 billion with the highest growth at 17.5%.
Here is a table of Amazon’s net sales revenue over recent quarters:
| Quarter | Net Sales Revenue |
| Q2 2025 | $167.7 billion |
| Q2 2024 | $148 billion |
| Q1 2023 | $127.4 billion |
| Q4 2022 | $149.2 billion |
| Q3 2022 | $127.1 billion |
| Q2 2022 | $121.23 billion |
| Q1 2022 | $116.44 billion |
| Q4 2021 | $137.41 billion |
| Q3 2021 | $110.81 billion |
| Q2 2021 | $113.08 billion |
Source: Statista.
Amazon’s revenue peaks in 2022 at $513.98 billion, up 9.1% from 2021. In 2024, net sales hit $638 billion, with net income at $59.2 billion, up 95% from 2023.
By segment in Q2 2025:
| Segment | Q2 2025 Sales (B) | Q2 2024 Sales (B) | YoY Growth | Share of Total Revenue |
| North America | $100.1 | $90.0 | 11% | 60% |
| International | $36.8 | $31.7 | 16% | 22% |
| AWS | $30.9 | $26.3 | 17.5% | 18% |
Source: About Amazon
- Online stores earn $61.5 billion, up 11%. Advertising jumps 23% to $15.7 billion. Subscription services rise 12% to $12.2 billion.
- Net product sales total $68.2 billion, while services hit $99.5 billion with 15% growth.
- In the first half of 2025, total net sales reached $323.4 billion, up 11%.
- Quarterly revenue exceeds $140 billion since Q1 2024, peaking at $187.8 billion in Q4 2024.
| Quarter | Total Sales (B) | YoY Growth |
| Q1 2024 | $143.3 | 13% |
| Q2 2024 | $148.0 | 10% |
| Q3 2024 | $158.9 | 11% |
| Q4 2024 | $187.8 | 11% |
| Q1 2025 | $155.7 | 9% |
| Q2 2025 | $167.7 | 13% |
Annual revenue over years:
| Year | Net Revenue (Billion) |
| 2022 | 513.98 |
| 2021 | 469.82 |
| 2020 | 386.06 |
| 2019 | 280.52 |
| 2018 | 232.89 |
These figures show steady growth. Investors use them to predict stock performance. Sellers benefit by aligning products with high-growth segments like services.
Amazon Revenue by Country
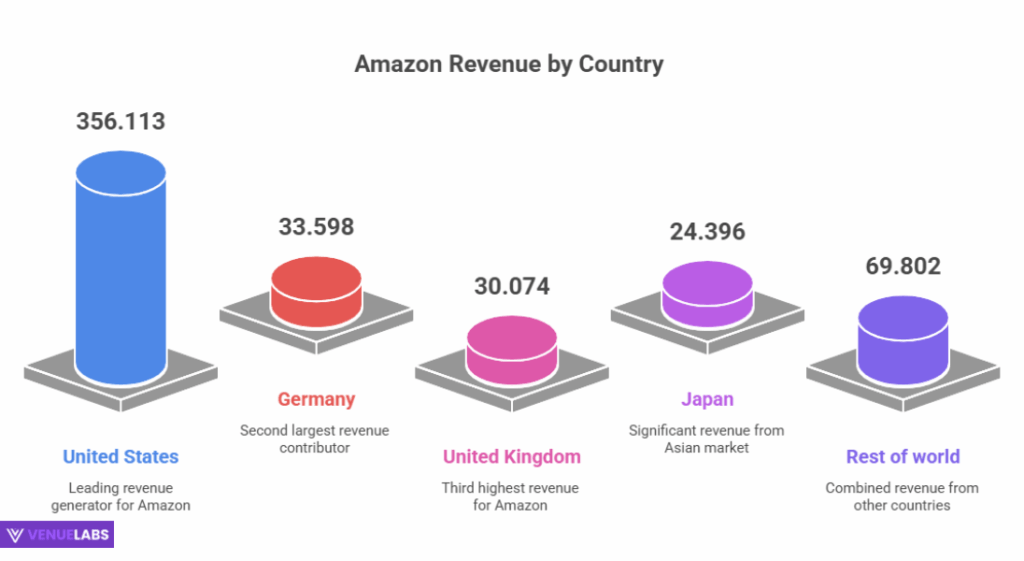
The U.S. leads Amazon’s revenue at $356.113 billion in 2022. Germany follows at $33.598 billion, the UK at $30.074 billion.
| Country | 2022 (B) | 2021 (B) | 2020 (B) |
| United States | 356.113 | 314.006 | 263.520 |
| Germany | 33.598 | 37.326 | 29.565 |
| United Kingdom | 30.074 | 31.914 | 26.483 |
| Japan | 24.396 | 23.071 | 20.461 |
| Rest of world | 69.802 | 63.505 | 46.035 |
In 2024, Germany revenue hits $40.9 billion (up 8.7%), UK $37.85 billion (up 13%). U.S. business remains most profitable.
Buyers in these countries enjoy localized deals. Sellers expand internationally for more revenue.
Amazon Traffic Statistics 2026
Amazon.com receives 2.56 billion visits in 2025, ranking #12 globally and #5 in the U.S. Traffic drops 8.49% from May, but direct visits make up 67%. Google organic search adds 14.6%.
Users spend 11 minutes 33 seconds per session, viewing 6.59 pages. Mobile drives 59.52% of traffic.
By country:
| Country | Share (%) | Visits | Desktop (%) | Mobile (%) |
| United States | 83.12 | 2.13B | 38.68 | 61.32 |
| India | 1.91 | 48.83M | 30.36 | 69.64 |
| Canada | 0.86 | 21.94M | 48.52 | 51.48 |
| Brazil | 0.79 | 20.10M | 36.44 | 63.56 |
| Mexico | 0.75 | 19.15M | 30.24 | 69.76 |
These stats help sellers target ads. Buyers find faster navigation on mobile.
How Many People Use Amazon in 2026?
- Amazon Prime grows to over 250 million members from 46 million in 2016. E-commerce users number around 500 million. Prime Video reaches 230 million, Prime Music 75 million.
- Monthly active users range from 300 to 600 million globally. Daily active users hit 48 to 107 million. Total accounts likely 800 million to 1.28 billion.
- The U.S. accounts for 83% of traffic, meaning 266 to 355 million monthly users there. Over 310 million active users worldwide in 2025.
- Buyers use this scale for diverse products. Sellers reach vast audiences.
Amazon Sales Statistics 2026
Amazon has 1.9 million selling partners. Third-party sellers contribute 62% of products sold, 60% of sales. Over 350 million products available.
Nearly 50% of U.S. sellers use FBA. Amazon generates $1.75 billion in daily sales in 2024.
From Quora discussions, users ask about FBA profitability. Most sellers earn $1,000 monthly, but top ones hit $250,000. Around 25% make real profit, with average full-time income $500-2,000/month. Average selling price sits at $50-60, margins 10-40%. Over 30% see Amazon as key for living.
On Reddit, sellers discuss sales drops but plan to double 2024 sales by focusing on seasonal items and FBM. China-based sellers now lead 3P revenue at 48.9%, U.S. at 38.4%.
Sellers benefit by using tools like Helium 10 or Jungle Scout for product research. Aim for 500 items to reach $10,000 revenue. Challenges include saturation and learning curves.
Amazon Prime Day Sales Statistics 2026
U.S. consumers spend $24.1 billion during Prime Day 2025 (July 8-11), up 30.3% from 2024. Mobile shopping accounts for 53.2%. AI tools surge 3,300% for deals. Influencers drive 19.9% of sales, 10x more than traditional social media.
However, Reddit users note a 41% plunge on the first day, showing mixed experiences. Globally, over 300 million items sold in 2024, slightly down from 375 million in 2023.
Buyers save big during these events. Sellers boost visibility with promotions.
Amazon AWS Statistics 2026
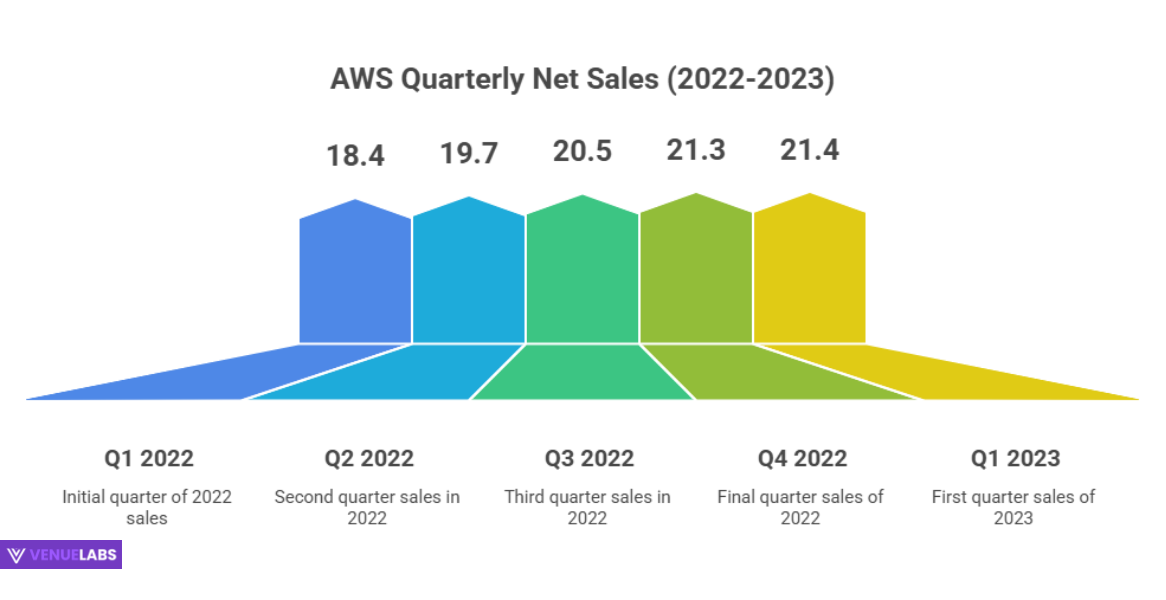
AWS earns $30.9 billion in Q2 2025, up 17%. Annual revenue hits $79.9 billion in 2022, from $62.1 billion in 2021.
| Quarter | AWS Net Sales (Billion) |
| Q1 2023 | 21.4 |
| Q4 2022 | 21.3 |
| Q3 2022 | 20.5 |
| Q2 2022 | 19.7 |
| Q1 2022 | 18.4 |
Businesses use AWS for cloud needs, saving costs on infrastructure.
Amazon Advertising Revenue 2026
Advertising hits $56.2 billion in 2024, up 18%. Projections reach $94 billion by 2026. U.S. alone grows to $64 billion. Sponsored Products make 68% of ad revenue.
| Year | Advertising Revenue (Billion) |
| 2022 | 37.7 |
| 2021 | 31.1 |
| 2020 | 15.5 |
Sellers use ads to increase visibility. Buyers see relevant products.
Amazon Subscription Revenue
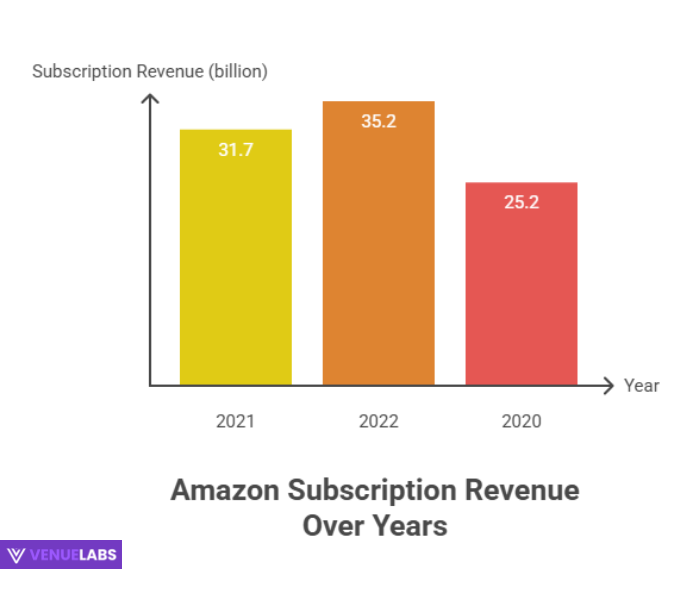
Subscriptions earn $35.2 billion in 2022, up from $31.7 billion in 2021. Prime subscriptions total $11.7 billion in Q1 2025, up 9%.
| Year | Subscription Revenue (Billion) |
| 2022 | 35.2 |
| 2021 | 31.7 |
| 2020 | 25.2 |
Prime offers value with video, music, and shipping.
Amazon Profit and Loss Analysis 2026
Amazon recovers from a $2.72 billion loss in 2022 to $59.2 billion profit in 2024. Q2 2025 net income hits $18.2 billion, up 35%. H1 2025 profit rises 47% to $35.29 billion.
Free cash flow drops to $18.2 billion due to $103 billion investments.
| Quarter | Profit (Million) |
| Q1 2023 | 3,172 |
| Q4 2022 | 278 |
| Q3 2022 | 2,872 |
| Q2 2022 | -2,028 |
| Q1 2022 | -3,844 |
Investors watch margins, which narrow as expenses take 88.2% of revenue.
Amazon E-commerce Revenue
E-commerce revenue totals $147.9 billion in Q2 2025, excluding AWS. It makes 88.2% of total revenue.
| Year | E-Commerce Net Sales (Billion) |
| 2025 (Q2 only) | 147.9 |
| 2024 | 520+ |
| 2022 | 142.43 |
| 2021 | 131.01 |
| 2020 | 120.90 |
Shipping costs rise 6% to $23.4 billion. Sellers manage costs with FBA.
Amazon Physical Stores vs. Online Stores
Online stores earn $61.485 billion in Q2 2025, physical $5.595 billion. Ratio is 10.6:1.
| Quarter | Online Stores (B) | Physical Stores (B) |
| Q1 2024 | 54.670 | 5.202 |
| Q2 2024 | 55.392 | 5.206 |
| Q3 2024 | 61.411 | 5.228 |
| Q4 2024 | 75.556 | 5.579 |
| Q1 2025 | 57.407 | 5.533 |
| Q2 2025 | 61.485 | 5.595 |
Buyers prefer online for convenience.
Amazon Acquisitions in 2026
Amazon makes 109 acquisitions by 2025. Most expensive: Whole Foods at $13.7 billion in 2017.
| Acquisition | Year | Cost (Million) |
| Whole Foods | 2017 | 13,700 |
| Metro-Goldwyn-Mayer | 2021 | 8,450 |
| One Medical | 2022 | 3,900 |
| Zoox | 2020 | 1,300 |
| Zappos | 2009 | 1,200 |
These expand Amazon’s reach. Users gain from integrated services.
Amazon User Habits and Customer Behavior
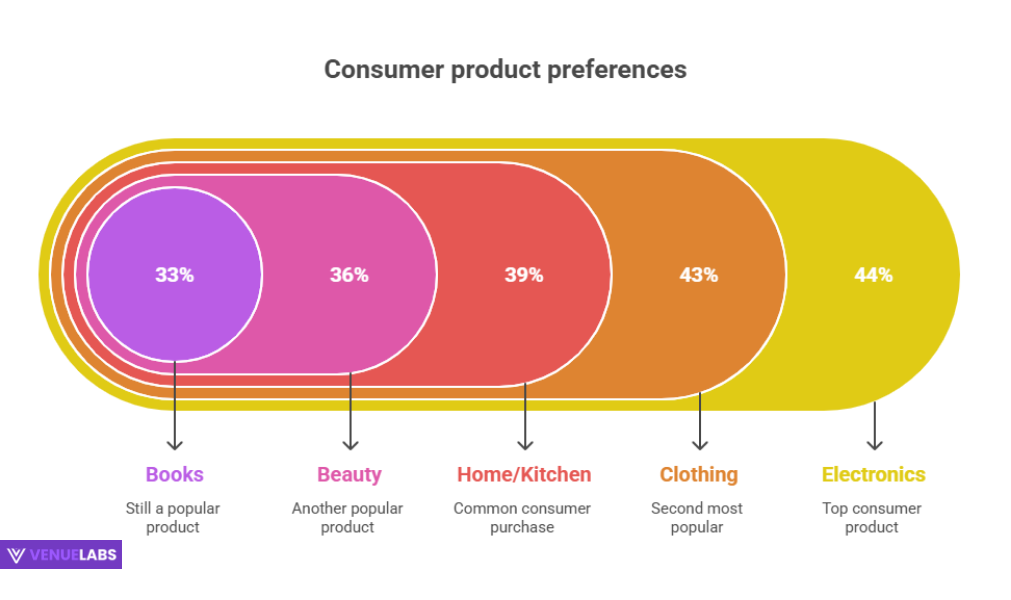
Over 65% shop via desktop, 16.6% mobile web, 13.6% app. Electronics top purchases at 44%, clothing 43%.
| Products | Percentage of Consumers |
| Electronics | 44% |
| Clothing, shoes, jewelry | 43% |
| Home and Kitchen | 39% |
| Beauty and personal care | 36% |
| Books | 33% |
80% choose Amazon for fast shipping, 69% for selection.
| Reasons | Percentage of Shoppers |
| Fast and free shipping | 80% |
| Wide selection | 69% |
| Best prices | 49% |
| Easy returns | 44% |
66% start product searches on Amazon. Black Friday sales surge 476% in Italy.
Buyers save by comparing prices. Sellers optimize listings for these habits.
Latest Insights from Quora and Reddit on Amazon Statistics 2026
Users on Quora discuss FBA success. Many ask if dropshipping remains profitable in 2025—it does, but saturation challenges newcomers. Tools like Helium 10 help find products.
On Reddit, sellers share stats on layoffs and income drops for Flex drivers to $39.7 per 3-hour block. Discussions highlight Amazon’s 1.5 million employees, ranking fourth globally. H1B visas: Amazon leads with 10,044 in 2025. These add real-user perspectives. Sellers use them to set realistic goals.
How You Can Use Amazon for Your Benefit
As a buyer, join Prime for savings—over two-thirds of U.S. users do. Use AI tools during sales for deals.
- Sellers: Focus on FBA for 50% of units. Use analytics like Jungle Scout. Aim for 15%+ margins, as 55% of small businesses achieve.
- Investors: Track AWS growth and ad revenue for stock decisions. Amazon’s market cap hits $2.36 trillion.
- Businesses: Leverage AWS for scalable cloud solutions.
FAQs About Amazon Statistics
1. What is Amazon's market share in the U.S. in 2025?
Amazon holds 37.6% of the U.S. e-commerce market in 2025, making it the top platform ahead of Walmart and Apple.
2. How many Prime members does Amazon have in 2025?
Amazon boasts over 250 million Prime members worldwide in 2025, offering benefits like fast shipping and streaming services.
3. What is AWS's revenue growth in 2025?
AWS shows a 17.5% year-over-year growth in Q2 2025, earning $30.9 billion and leading Amazon’s segments.
4. How profitable is selling on Amazon FBA in 2025?
Selling on Amazon FBA remains profitable for many, with average monthly earnings around $1,000, though top sellers reach up to $250,000, and about 25% achieve real profits based on user discussions.
5. What drives Amazon's advertising revenue in 2025?
Amazon’s advertising revenue grows due to Sponsored Products, which make up 68% of ad income, projecting to hit $94 billion by 2026.
Also Read:
- Pinterest Statistics
- Tumblr Statistics
- YouTube Shorts Statistics
- Google Chrome Statistics
- Mobile Internet Traffic Statistics
Conclusion
In conclusion, Amazon’s dominance in 2025 is undeniable, with impressive statistics across e-commerce, cloud computing, and advertising.
The company holds a 37.6% share of the U.S. e-commerce market, generates billions in revenue, and continues to innovate through AWS and advertising.
With over 250 million Prime members, a global user base, and strong revenue growth, Amazon remains a top choice for both buyers and sellers.
Whether you’re looking to save with Prime, boost sales with FBA, or track potential investments, understanding these key insights can help you navigate the ever-evolving Amazon ecosystem.


Comments
Be the first to leave a comment.