The world in our pockets has truly transformed our lives. Think about it: from the moment your mobile alarm nudges you awake to winding down with music on your phone before sleep, mobile devices orchestrate our daily rhythms.
With over 90% of the global population owning a mobile phone, this tiny marvel has not just made life easier but has also fundamentally reshaped how we connect, work, and engage with the digital world. This massive shift has a direct impact on digital marketing, e-commerce, and numerous other industries.
This article dives deep into the fascinating world of mobile internet traffic statistics 2025. We will explore where most mobile traffic originates, the activities people perform on their devices, and how much time they dedicate to mobile use. We will also address burning questions from online communities, such as Quora and Reddit.
Our goal is to provide a comprehensive, easy-to-understand guide for anyone who wants to grasp the power of mobile internet and harness it for their advantage.
The Mobile Takeover: A Global Perspective
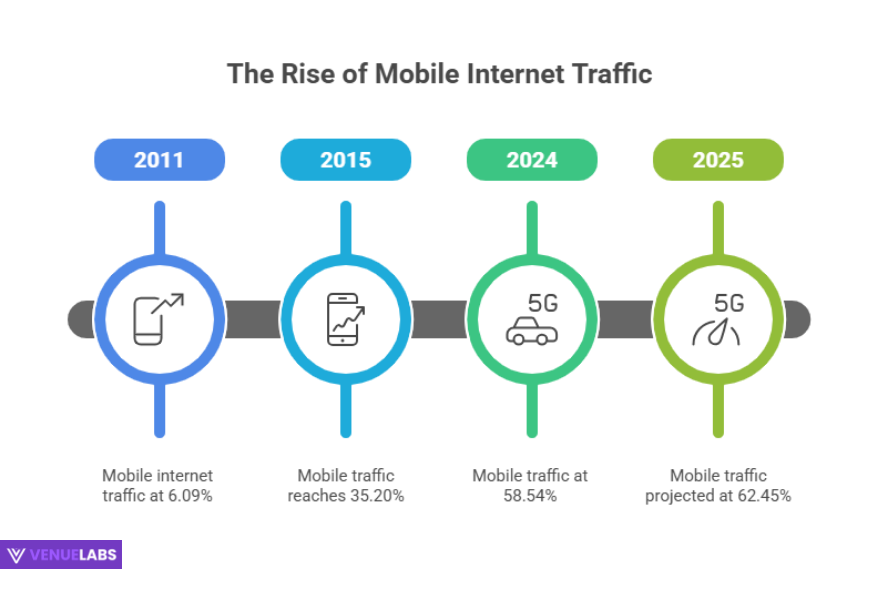
Mobile devices now dominate how people access the internet. This isn’t just a trend; it is the new normal. Globally, more than 63.38% of all internet traffic now comes from mobile devices, a significant leap from just 35.20% in 2015.
This consistent growth underscores the importance of a mobile-first approach for any online endeavor.
Let’s look at how mobile internet traffic has steadily climbed over the years:
| Year | Mobile Internet Traffic (Global) |
| 2011 | 6.09% |
| 2012 | 10.88% |
| 2013 | 17.02% |
| 2014 | 28.97% |
| 2015 | 35.20% |
| 2016 | 43.66% |
| 2017 | 51.58% |
| 2018 | 50.81% |
| 2019 | 50.43% |
| 2020 | 51.61% |
| 2021 | 55.01% |
| 2022 | 58.37% |
| 2023 | 60.67% |
| 2024 | 58.54% |
| 2025 | 62.45% |
Source: Statista
You can clearly see that mobile traffic crossed the 50% mark in 2017 and continues its upward trajectory, demonstrating its undeniable dominance.
Mobile Internet Traffic in the United States
While global mobile internet traffic strongly favors mobile, the United States presents a slightly different picture.
In the US, 47.3% of all internet traffic currently comes from mobile devices, with desktop still holding a slight lead at 50.2%. However, the gap is narrowing rapidly, and projections for 2025 continue to show mobile gaining ground.
Consider the evolution of mobile internet traffic in the US:
| Year | Mobile Internet Traffic (US) |
| 2011 | 7.28% |
| 2012 | 10.10% |
| 2013 | 14.64% |
| 2014 | 25.46% |
| 2015 | 29.02% |
| 2016 | 33.80% |
| 2017 | 43.96% |
| 2018 | 44.36% |
| 2019 | 47.86% |
| 2020 | 49.99% |
| 2021 | 49.32% |
| 2022 | 50.52% |
| 2023 | 35.73% |
| 2024 | 43.09% |
| 2025 | 47.3% |
It is essential to note the fluctuating percentages in the US data for 2023 and 2024, which may reflect shifts in reporting methodologies or temporary changes in user behavior. However, the overarching trend points towards continued strong mobile usage.
Experts estimate the mobile internet traffic in the United States to be around 10.04 exabytes per month. This vast amount of data highlights the sheer volume of online activity happening on mobile devices across the nation.
| Year | Estimated Mobile Internet Traffic (US, Exabytes Per Month) |
| 2018 | 2.33 |
| 2019 | 3.12 |
| 2020 | 4.18 |
| 2021 | 5.6 |
| 2022 | 7.5 |
| 2023 | 10.05 |
Source: StatCounter
The Browser Battle: Who Leads on Mobile?
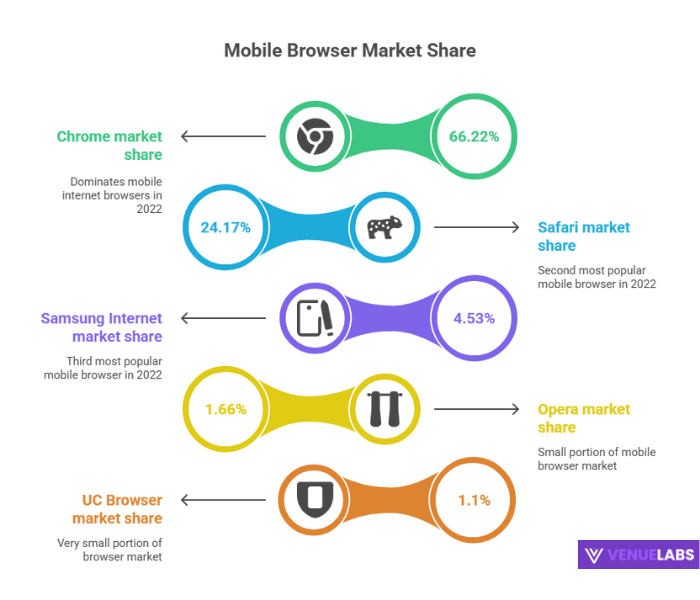
When people access the internet on their phones, which browser do they choose? Globally, Chrome firmly holds the top spot, capturing 66.22% of the total market share in mobile internet browsers in 2022. This dominance means that optimizing for Chrome provides the broadest reach for mobile users.
Here is a breakdown of the market share for popular mobile internet browsers:
| Mobile Internet Browsers | Market Share (2022) |
| Chrome | 66.22% |
| Safari | 24.17% |
| Samsung Internet | 4.53% |
| Opera | 1.66% |
| UC Browser | 1.1% |
| Android | 0.76% |
| IEMobile | 0.01% |
| Other | 1.55% |
| Nokia | 0% |
| Blackberry | 0% |
| NetFront | 0% |
Safari, primarily used by Apple device owners, secures the second position. Knowing these statistics helps businesses focus their web development and marketing efforts to ensure a seamless experience for the majority of mobile users.
- Also read about: Google Searches Statistics
The Ever-Growing Mobile User Base
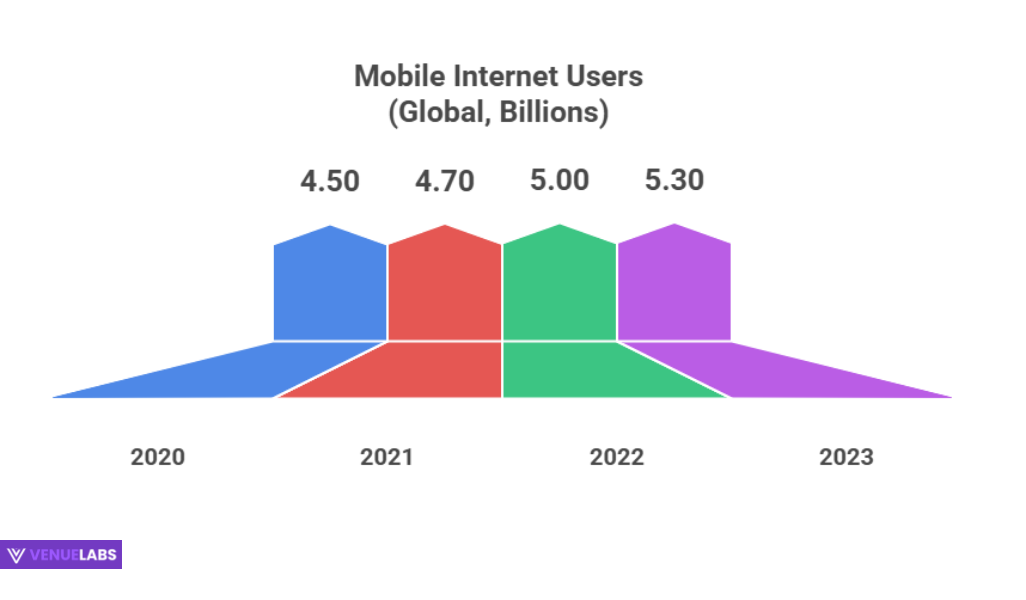
The number of people using mobile devices to access the internet continues to climb year after year. Currently, more than 5.3 billion people globally use their mobile phones to go online.
This number is projected to reach an astounding 5.8 billion by 2026. This growth is a clear indicator that mobile access is not just a convenience but a fundamental part of internet usage worldwide.
Let’s look at the impressive growth of global mobile internet users:
| Year | Mobile Internet Users (Global, Billions) |
| 2018 | 3.90 |
| 2019 | 4.20 |
| 2020 | 4.50 |
| 2021 | 4.70 |
| 2022 | 5.00 |
| 2023 | 5.30 |
In the United States, we see similar robust growth in mobile internet users. There are 287.5 million mobile internet users in the US today, and experts project this number to reach over 303 million by 2027.
| Year | Mobile Internet Users in the U.S. (Millions) |
| 2018 | 253.82 |
| 2019 | 262.07 |
| 2020 | 270.55 |
| 2021 | 276.83 |
| 2022 | 282.48 |
| 2023 | 287.50 |
| 2024 | 292.03 |
| 2025* | 296.18 |
| 2026* | 300.02 |
| 2027* | 303.62 |
| *Projected |
This expansion means that an increasing percentage of internet users rely solely on their mobile devices for online access. In fact, 92.30% of global internet users access the internet through their mobile phones, and 85.38% of mobile users in the United States do the same. This underscores the critical need for all online content and services to be mobile-friendly.
Time Spent on Mobile: A Significant Investment
People are not just accessing the internet on mobile; they are dedicating a significant portion of their online time to it. Globally, internet users spent 56.03% of their total time browsing the internet via mobile in 2022.
This figure represents a steady increase over the last decade, showing a clear shift in how we consume online content.
| Year | Total Time Spent On The Internet Via Mobile |
| 2013 | 27.3% |
| 2014 | 33.1% |
| 2015 | 37.7% |
| 2016 | 39.1% |
| 2017 | 45.6% |
| 2018 | 49.4% |
| 2019 | 50.8% |
| 2020 | 52.37% |
| 2021 | 53.05% |
| 2022 | 56.03% |
This trend highlights that mobile devices are no longer just for quick checks; they are central to prolonged engagement with online content and services.
Mobile Internet Traffic by Region: A Diverse Landscape
The global mobile internet landscape reveals fascinating regional differences. While mobile traffic dominates worldwide, some continents and countries show even higher reliance on mobile devices.
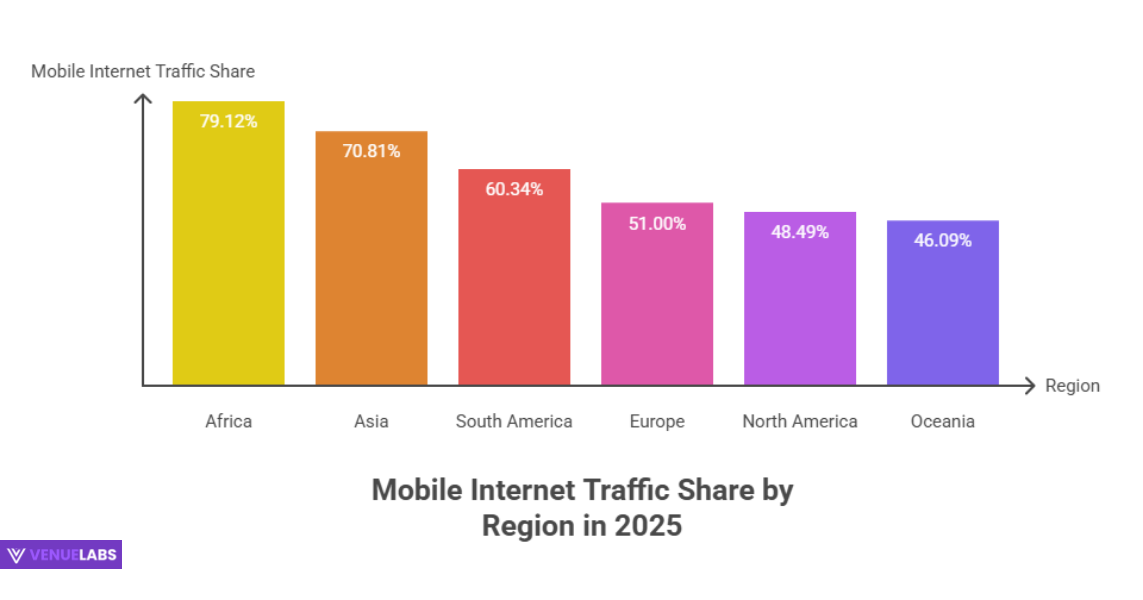
Let’s explore mobile internet traffic percentages by region:
| Region | Mobile Internet Traffic (2023) |
| Africa | 79.12% |
| Asia | 70.81% |
| South America | 60.34% |
| Europe | 50.64% |
| Oceania | 46.09% |
| North America | 47.59% |
Africa and Asia lead the charge, with the vast majority of their internet traffic coming from mobile devices. This often reflects a “mobile-first” or even “mobile-only” internet adoption due to infrastructure development.
Here’s a detailed look at the growth within each continent:
Africa’s Mobile Surge:
| Year | Mobile Internet Traffic (Africa) |
| 2011 | 8.47% |
| 2012 | 13.78% |
| 2013 | 26.97% |
| 2014 | 39.11% |
| 2015 | 50.63% |
| 2016 | 61.56% |
| 2017 | 63.38% |
| 2018 | 62.47% |
| 2019 | 58.51% |
| 2020 | 62.59% |
| 2021 | 69.48% |
| 2022 | 69.59% |
| 2023 | 79.12% |
Asia’s Mobile Dominance:
| Year | Mobile Internet Traffic (Asia) |
| 2011 | 9.56% |
| 2012 | 18.47% |
| 2013 | 26.90% |
| 2014 | 39.50% |
| 2015 | 50.49% |
| 2016 | 60.27% |
| 2017 | 67.67% |
| 2018 | 65.72% |
| 2019 | 62.41% |
| 2020 | 61.66% |
| 2021 | 65.70% |
| 2022 | 69.01% |
| 2023 | 70.81% |
South America’s Growing Mobile Engagement:
| Year | Mobile Internet Traffic (South America) |
| 2011 | 2.73% |
| 2012 | 3.38% |
| 2013 | 6.93% |
| 2014 | 18.07% |
| 2015 | 25.19% |
| 2016 | 30.91% |
| 2017 | 36.85% |
| 2018 | 34.24% |
| 2019 | 32.53% |
| 2020 | 37.81% |
| 2021 | 51.34% |
| 2022 | 56.53% |
| 2023 | 60.34% |
Europe’s Strong Mobile Presence:
| Year | Mobile Internet Traffic (Europe) |
| 2011 | 2.92% |
| 2012 | 5.66% |
| 2013 | 9.36% |
| 2014 | 21.54% |
| 2015 | 23.66% |
| 2016 | 30.29% |
| 2017 | 36.90% |
| 2018 | 39.94% |
| 2019 | 43.61% |
| 2020 | 45.77% |
| 2021 | 47.04% |
| 2022 | 50.75% |
| 2023 | 50.64% |
North America’s Evolving Landscape:
| Year | Mobile Internet Traffic (North America) |
| 2011 | 6.85% |
| 2012 | 9.46% |
| 2013 | 14.06% |
| 2014 | 24.79% |
| 2015 | 28.77% |
| 2016 | 34.10% |
| 2017 | 42.93% |
| 2018 | 42.99% |
| 2019 | 45.76% |
| 2020 | 48.54% |
| 2021 | 48.81% |
| 2022 | 51.19% |
| 2023 | 47.59% |
Oceania’s Increasing Mobile Usage:
| Year | Mobile Internet Traffic (Oceania) |
| 2011 | 4.84% |
| 2012 | 8.55% |
| 2013 | 14.26% |
| 2014 | 22.00% |
| 2015 | 28.29% |
| 2016 | 34.67% |
| 2017 | 41.36% |
| 2018 | 41.68% |
| 2019 | 45.18% |
| 2020 | 45.59% |
| 2021 | 43.40% |
| 2022 | 42.75% |
| 2023 | 46.09% |
Countries Leading the Mobile Charge
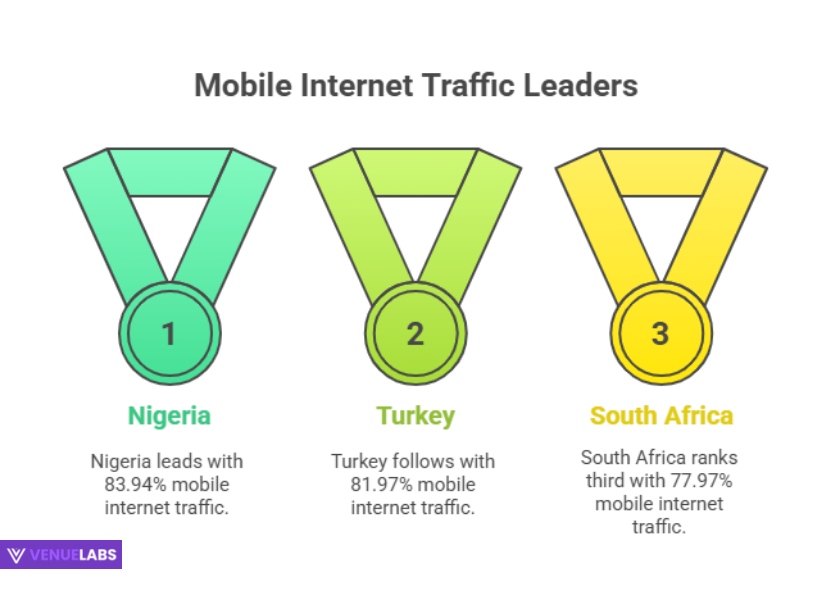
Certain countries stand out for their particularly high mobile internet traffic. Nigeria, for example, receives an impressive 83.94% of all its internet traffic from mobile devices. This highlights the varied digital adoption patterns across the globe.
| Top Countries | Mobile Internet Traffic (2023) |
| Nigeria | 83.94% |
| Turkey | 81.97% |
| South Africa | 77.97% |
| Vietnam | 76.69% |
| Saudi Arabia | 75.18% |
| India | 75.09% |
| Ghana | 74.78% |
| Kenya | 74% |
| Singapore | 72.54% |
| Indonesia | 66.56% |
| China | 63.34% |
| Poland | 62% |
| Ireland | 61.24% |
| Thailand | 61.23% |
| Argentina | 60.91% |
| UAE | 57.67% |
| Brazil | 56.37% |
| Morocco | 56.39% |
| Spain | 54.97% |
| Malaysia | 54.73% |
| South Korea | 54.10% |
| Egypt | 52.74% |
| Italy | 52.69% |
| Philippines | 50.8% |
| France | 50.56% |
| The United States | 47.79% |
These statistics show that mobile is the primary gateway to the internet for billions of people, particularly in developing nations.
What Are People Doing on Their Phones?
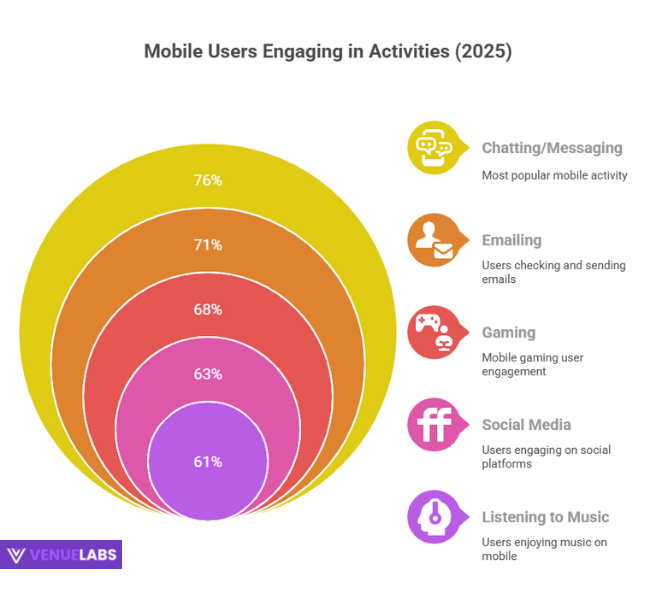
Mobile devices are not just for basic browsing; they power a wide range of daily activities. From connecting with loved ones to managing finances, our phones are indispensable tools.
| Mobile Phone Activity | Share Of Respondents (2022) |
| Sending messages or Chatting | 76% |
| E-mailing | 71% |
| Listening to Music | 61% |
| Online Banking | 61% |
| Watching Videos | 61% |
| Searching For Products | 57% |
| Buying Products | 56% |
| Uploading Videos or Photos | 56% |
| Reading News Pages | 54% |
| Making Internet Calls | 49% |
| Navigation Services/Using Online Maps | 46% |
| Watching Series/Movies | 44% |
| Comparing Prices | 42% |
| Online Game/Video Gaming | 39% |
| Visiting Special Deal Pages | 38% |
| Reading Blogs | 29% |
| Listening to Internet Radio | 27% |
| Watching TV Live | 25% |
| Job Search | 24% |
| Listening to Podcast | 24% |
| Visiting Travelling Pages | 24% |
| Writing Comments in Forum | 23% |
| Selling Products | 21% |
| Writing Customer reviews | 20% |
| None of the Above | 1% |
| No Answer | 0% |
This diverse list confirms that mobile phones are versatile devices supporting both communication and transactional activities.
The Power of Mobile Search
Mobile devices have become our go-to for information. Whether we need to check the weather or research a product, our phones are the first place we turn. This habit has significant implications for businesses and their online presence.
- 41% of shoppers search on mobile about products while they are in the store. This highlights the importance of local SEO and immediate access to product information.
- 53% of shoppers search on their mobile about products when they are at home, indicating research before or after a store visit.
- 51% of shoppers search on mobile about products when they are about to leave home, suggesting pre-shopping research.
- 96% of mobile search traffic comes from Google. This statistic reinforces Google’s immense dominance in the mobile search landscape.
- 70% of shoppers call a business directly from the mobile search result page. This highlights the importance of having easily accessible contact information in search results.
These numbers demonstrate the critical role mobile search plays in the consumer journey, from initial interest to direct engagement.
E-commerce on the Go: Mobile Shopping Dominates
E-commerce has boomed, and mobile devices fuel a significant portion of this growth. People are increasingly comfortable purchasing products directly from their smartphones.
- 72% of all retail website traffic came from mobile devices in the United States in 2022.
- 62% of total orders of retail websites came from mobile devices in the United States in 2022.
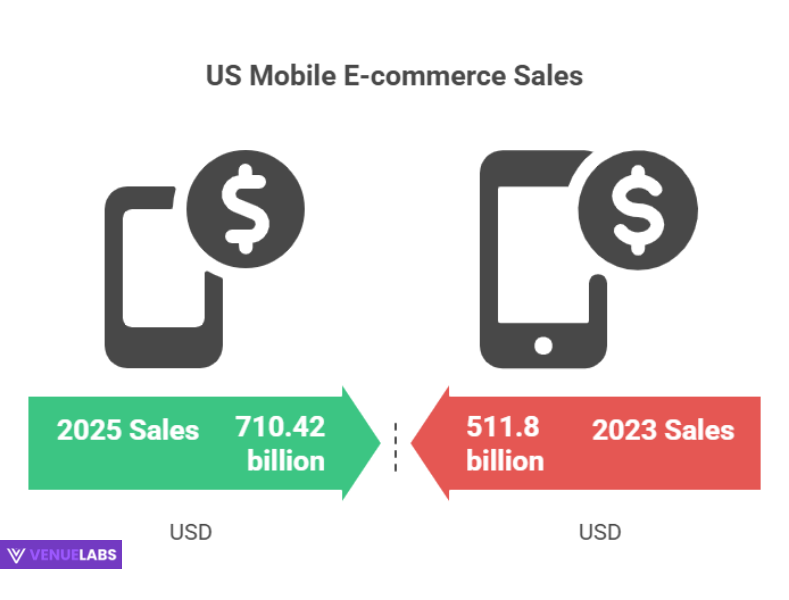
- In the United States, $511.8 billion in retail e-commerce sales came from mobile devices in 2023. This is projected to grow to an incredible $710.42 billion by 2025.
| Year | Total Retail e-commerce Sales (US, Billions) |
| 2019 | 220.67 |
| 2020 | 311.93 |
| 2021 | 362.11 |
| 2022 | 431.4 |
| 2023 | 511.8 |
| 2024 | 604.5 |
| 2025* | 710.42 |
| *Projected |
The total mobile commerce share of total digital commerce spending in the United States was 35.25% in 2022. This shows mobile’s growing influence on how we spend our money online.
Social Media: A Mobile-First Connection
Social media and mobile phones are inseparable. Our phones allow us to stay constantly connected to friends, family, and the latest trends, making social media a profoundly mobile-first experience. There are 4.76 billion social media users worldwide, and a vast majority access these platforms via mobile.
- 90% of social media users in the United States accessed social media through their mobile phones in 2022.
- 86.5% of social media users in Canada accessed social media through their mobile phones in 2022.
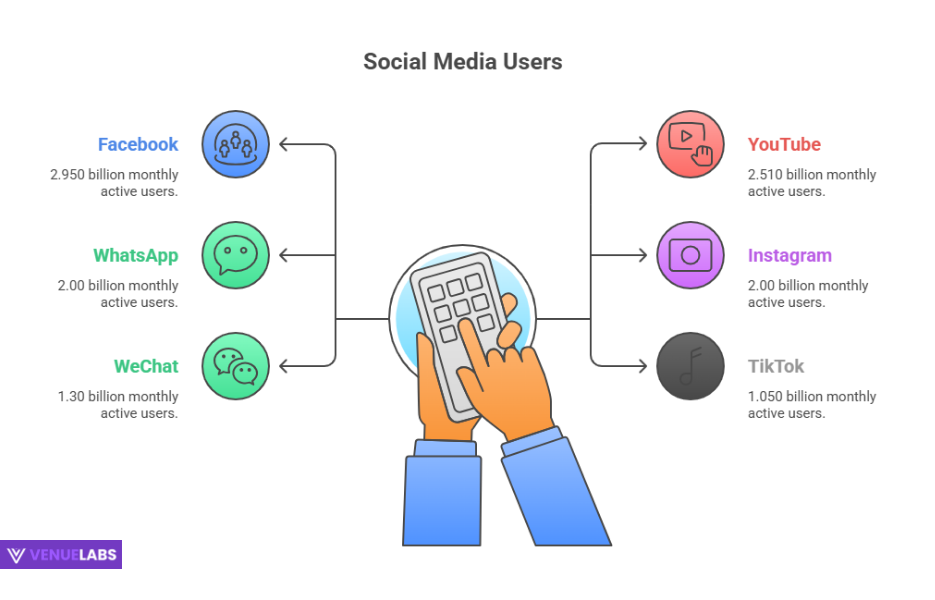
- Facebook remains the most popular social media network globally, boasting 2.95 billion monthly active users.
Here’s a look at the top social media networks by monthly active users:
| Social Media Network | Monthly Active Users (Billions) |
| 2.950 | |
| YouTube | 2.510 |
| 2.00 | |
| 2.00 | |
| 1.30 | |
| TikTok | 1.050 |
| Facebook Messenger | 0.930 |
| Douyin | 0.710 |
| Telegram | 0.700 |
| Snapchat | 0.630 |
| Kuaishou | 0.620 |
| Sina Weibo | 0.580 |
| 0.570 | |
| 0.550 | |
| 0.440 |
WhatsApp also stands out as the most popular mobile messenger app, with 2 billion monthly active users.
| Mobile Messenger App | Monthly Active Users (Billions, 2020) |
| 2.00 | |
| 1.20 | |
| Facebook Messenger | 0.988 |
| 0.574 | |
| Snapchat | 0.557 |
| Telegram | 0.550 |
These figures underscore the indispensable role mobile devices play in our social interactions and digital communities.
Email: Always Within Reach
Email, a cornerstone of digital communication, has become even more accessible thanks to mobile technology. We can now check our inboxes from anywhere, at any time.
- 333.2 billion emails are sent every day globally.
- There has been a 180% rise in email opens on mobile devices in the last three years (2019-2022).
- 71% of users checked their email using their mobile devices in 2022.
- Recipients prefer 81% of emails to open on their mobile devices.
This data clearly shows that mobile email optimization is not just a nicety but a necessity for effective communication.
Mobile Gaming: A Massive Industry
Gaming on mobile devices has exploded, becoming a global phenomenon and a massive industry. Millions of people worldwide now play games on their phones, transforming casual entertainment into a significant market.
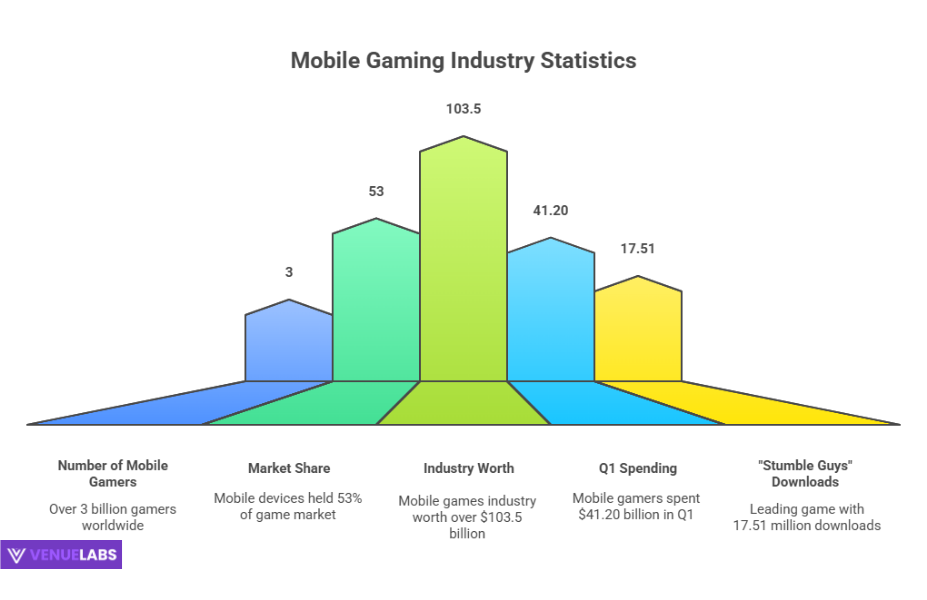
- There were more than 3 billion mobile gamers in the world in 2022.
- Mobile devices held 53% of the total game market in 2022.
- The mobile games industry was worth over $103.5 billion in 2022.
- Mobile gamers spent $41.20 billion in Q1 of 2022 alone.
- “Stumble Guys” was the leading game worldwide, with 17.51 million downloads from the Google Play Store.
Here are the top 10 leading games worldwide by Google Play Store downloads in 2022:
| Leading Game | Number Of Downloads (Millions) |
| Stumble Guys | 17.51 |
| Stick War | 15.07 |
| School Party Craft | 11.19 |
| Save the Doge | 10.59 |
| Subway Surfers | 10.11 |
| Survivor.io | 8.52 |
| Roblox | 8.47 |
| Gun Head Run | 7.67 |
| GT Car Stunt Master 3D | 7.48 |
| Truckers of Europe 3 | 7.24 |
This demonstrates the immense popularity and financial power of mobile gaming.
The Evolution of Mobile Broadband: From 2G to 5G and Beyond
Mobile broadband technology has advanced dramatically, bringing faster speeds and enhanced capabilities with each new generation. From the early days of 2G to the current rollout of 5G, these networks have become essential for our daily mobile internet experiences.
- 84.5 exabytes of mobile data per month were used by 2G, 3G, and 4G networks in 2023.
- 31 exabytes of mobile data per month were used by 5G networks in 2023.
- Fixed wireless access networks accounted for 33.4 exabytes of mobile data per month in 2023.
The transition to 5G is a major development, promising even faster speeds and lower latency, which will further enhance mobile internet experiences.
| Year | FWA (3G,4G,5G, Exabytes) | Mobile Data (5G, Exabytes) | Mobile Data (2G,3G,4G, Exabytes) |
| 2018 | 4.4 | 0 | 22.2 |
| 2019 | 6.2 | 1.3 | 33.4 |
| 2020 | 9.7 | 1.7 | 47.2 |
| 2021 | 16.6 | 6.7 | 60.9 |
| 2022 | 24.4 | 15.2 | 74.8 |
| 2023 | 33.4 | 31 | 84.5 |
| 2024 | 45.8 | 50.7 | 95.4 |
| 2025 | 61.8 | 79.2 | 104.4 |
| 2026* | 81 | 117.5 | 110.3 |
| 2027* | 103.1 | 166.2 | 110.7 |
| 2028* | 128.5 | 224.6 | 99.6 |
| *Predicted |
Experts predict that there will be more than 1 billion 5G connections globally by 2025. Furthermore, they expect 68% of internet users in the United States to use a 5G connection by 2025.
| Connections (US, 2025*) | Share Of Users |
| 2G | 0% |
| 3G | 1% |
| 4G | 31% |
| 5G | 68% |
| *Predicted |
China will lead with 866 million 5G connections by 2025, while the United States will have 247 million 5G connections.
| Country (2025*) | Share Of 5G Connections | Number Of 5G Connections (Billions) |
| China | 51.00% | 0.86 |
| The United States | 68.00% | 0.24 |
| Japan | 68.00% | 0.13 |
| Germany | 58.00% | 0.068 |
| South Korea | 73.00% | 0.045 |
| The United Kingdom | 57.00% | 0.042 |
| France | 49.00% | 0.035 |
| Canada | 51.00% | 0.020 |
| *Predicted |
The rapid adoption of 5G will significantly impact how we use mobile internet, opening doors for new applications and enhanced experiences.
Addressing User Questions from Quora and Reddit (Latest Insights)
Beyond the raw statistics, real users on platforms like Quora and Reddit often ask practical questions about mobile internet traffic.
Here’s a look at some common themes and insights:
- “Is Wi-Fi always better than mobile data?”
- Not necessarily! While Wi-Fi can be more stable and often unlimited, 5G mobile data speeds are now rivalling and even exceeding many home broadband connections in urban areas. For many, 5G offers a fantastic, reliable experience, especially with modern data plans offering generous allowances.
- “How can I reduce my mobile data usage without feeling completely disconnected?”
- Users are actively seeking ways to manage data. Tips often include utilizing Wi-Fi whenever possible, downloading content like music and videos for offline viewing, adjusting streaming quality to standard definition, disabling auto-play for videos on social media, and enabling data saver modes on apps and in phone settings. Many apps also offer “lite” versions that consume less data.
- “What’s the deal with mobile apps vs. mobile websites for businesses?”
- This is a huge discussion! While websites are essential for initial discovery, mobile apps generally offer a more personalized, faster, and more engaging experience. Users spend nearly 90% of their time on mobile devices using apps. Apps also boast a 157% higher conversion rate than mobile websites. For businesses, a strong mobile app can be a powerful tool for customer loyalty and conversions, especially given that over 100 billion hours are spent each year using shopping apps.
- “Are slow mobile internet speeds still a big problem everywhere?”
- While some regions still face challenges, average global mobile download speeds are improving, reaching around 41.54 Mbps. Countries like the UAE (178.25 Mbps) and Qatar (174.56 Mbps) demonstrate incredibly fast mobile internet. However, disparities remain, with some countries experiencing speeds as low as 3.44 Mbps. So, it really depends on your location.
- “With so much mobile traffic, how important is mobile-first design for my website?”
- It’s no longer just important; it’s critical. Google heavily favors mobile-friendly websites in its search rankings. If your website doesn’t offer a seamless experience on a smartphone, you risk losing a massive percentage of your potential audience and falling behind competitors. This applies to every aspect, from layout and navigation to loading speed and font size.
These questions highlight the practical concerns and strategic thinking users and businesses bring to the mobile internet landscape.
FAQs About Mobile Internet Traffic Statistics
1. How much of the total internet traffic comes from mobile devices today?
Globally, mobile devices account for a significant majority, comprising more than 62.45% of all internet traffic in 2025. In the United States, mobile traffic makes up 47.3% of the total internet traffic, steadily closing the gap with desktop usage.
2. What are the most common activities people perform on their mobile phones when accessing the internet?
People engage in a wide array of activities on their mobile phones; however, sending messages or chatting is the most popular, with 76% of users. Other leading activities include emailing (71%), listening to music (61%), online banking (61%), and watching videos (61%).
3. What primarily consumes the most mobile data on smartphones?
Mobile applications, particularly social media and streaming apps, typically consume the most mobile data. Apps like Facebook, Netflix, Instagram, YouTube, and Spotify are significant data users due to continuous content loading, video playback, and image sharing.
4. Is mobile gaming a substantial part of the mobile internet traffic landscape?
Yes, mobile gaming is a massive and rapidly growing sector within mobile internet traffic. In 2022, there were over 3 billion mobile gamers worldwide, and the mobile gaming industry itself was valued at more than $103.5 billion, representing 53% of the total game market.
Also Read:
- Perplexity AI Statistics
- LinkedIn Statistics
- Google Ads Statistics
- Quora Statistics
- AI Market Size Statistics
Conclusion: Embracing the Mobile Future
Mobile internet traffic has surged dramatically over the past few years and will continue its impressive growth. This shift fundamentally alters how we access information, interact with businesses, and connect with each other.
The pervasive adoption of mobile devices makes the internet more convenient and accessible than ever before, shaping our digital lives in profound ways.
As we have seen, the proportion of internet users relying on mobile devices varies significantly across regions, with Asia and Africa leading the charge.
This regional diversity emphasizes the need for tailored strategies based on target demographics. The convenience of mobile phones has made accessing social media, checking emails, shopping, and playing games ubiquitous, transforming these activities into anytime, anywhere experiences.
Continuous advancements in mobile broadband, particularly the rollout of 5G, promise even faster speeds and more seamless experiences for mobile users globally.
This ongoing evolution means that businesses, content creators, and individuals must remain agile, constantly optimizing their online presence for the mobile-first world. Staying informed about these dynamic statistics is key to understanding and leveraging the immense power of mobile internet traffic for your benefit.
